Letter from the editors
The SWIB (Semantic Web in Libraries) annual conference is one of the essential events related to Linked Open Data in libraries and other related organisations. EuropeanaTech has long been involved in this event as presenters, review board members and organisers.
SWIB19, the 11th conference was held 25 - 27 November 2019 in Hamburg and as always featured a top notch program featuring institutes from around the world who continue to further the possibilities and potential of LOD within digital cultural heritage.
With this issue of EuropeanaTech Insight, we took inspiration from the 2019 program, and invited several authors to elaborate on papers that were presented at the conference. Featured within this issue are articles from, ADAPT Centre, Trinity College Dublin, Ireland, Frankfurt University Library, Germany, Max Planck Institute for the History of Science, Germany, GWDG, Germany and kcoylenet jointly with Dublin Core Metadata Initiative.
We hope that you find these papers valuable and thought provoking. Work and research regarding Linked Open Data continues to be a top priority within the EuropeanaTech community. For those curious about the full program including slides and videos, you can find these here.
NAISC-L: An Authoritative Linked Data Interlinking Approach for the Library Domain
Lucy McKenna, Christophe Debruyne & Declan O’Sullivan
In 2017 we distributed a questionnaire to Information Professionals (IPs) in libraries, archives and museums (LAMs) in order to explore the benefits and challenges that they experienced when using Linked Data (LD) [1]. Of the 185 responses, over 60% indicated that LAMs face multiple barriers to using LD particularly in the areas of LD interlinking, tooling, integration, and resource quality. A more in-depth exploration of the interlinking issue highlighted that the processes of ontology and link type selection (determining and describing the relationship between two entities) were areas of particular difficulty. Participants also mentioned that LD tools are often technologically complex and unsuitable for the needs of LAMs. With regards to data integration, participants indicated that mapping between different vocabularies used across datasets poses a significant challenge. Participants also expressed concerns regarding the quality and the reliability of many currently published LD resources.
In response to the results of the survey, we developed a LD interlinking framework and accompanying tool specifically for the library domain. This framework and tool are summarised below, however, a more in-depth description of the framework can be found in McKenna, Debruyne and O’Sullivan (2019) [2]. We also discuss trialling NAISC-L at the Irish Traditional Music Archive.
The Semantic Web and Linked Data
The Web contains a vast amount of information presented in the form of documents linked together via hyperlinks. In order to find specific resources on the Web, search engines are used to rank webpages based on relevancy via keyword searches. While this is done to great effect, unlike humans, computers have very little understanding of the meaning of data on these webpages nor do they understand how they relate to each other.
The Semantic Web (SW) is an extension of the current Web in which individual units of information/data are given a well-defined meaning, and where the relationships between data are defined in a common machine-readable format [3]. These units of data are known as entities and an entity could be a person, place, organisation, object, concept or Thing. Linked Data (LD) involves creating unique identifiers for these entities and then linking them together by meaningfully describing how they are related. Entities can be linked to endless amounts of other related resources, creating a Web of Data.
A LD dataset is structured information encoded using the Resource Description Framework (RDF), the recommended model for representing and exchanging LD on the Web. RDF statements take the form of subject-predicate-object triples, which can be organised in graphs. Subjects and objects typically represent an entity such as a person, place or Thing, and predicate properties describe the relationship between the two. RDF requires that Unique Resource Identifiers (URIs), such as URLs and permalinks, are used to identify subjects and predicates. An object can also be identified by a URI or by a literal (i.e. plain text). These URIs allow for the data to be understood by computers.
Linked Data Interlinking
LD is classified according to a 5 Star rating scheme(https://5stardata.info/en/) and, in order to be considered 5 Star, a LD dataset must contain external interlinks to related data. LD interlinking describes the task creating a relationship between an entity in one LD dataset to an entity in another LD dataset. Interlinks can be used as a way of representing that both entities describe the same Thing or as a way of indicating that they are similar or related to one another in some capacity. Such links have the potential to transform the Web into a globally interlinked and searchable database allowing for richer data querying and for the development of novel applications built on top of the Web.
Upon reviewing the data on the Linked Open Data Cloud (https://lod-cloud.net) for some of the leading library LD projects, such as those of the Swedish (LIBRIS), French (BnF), Spanish (BnE), British (BNB) and German (DNB) National Libraries, it was found that the majority of interlinks are to authority files and controlled vocabularies. Although these types of interlinks are extremely useful, there is a notable lack of interlinks created for purposes outside of authority control. For instance, interlinking could also be used to enrich data by linking to external resources that provide additional information and context for a particular entity.
Our Research
The focus of our research was to develop an interlinking framework that would encourage the creation of different kinds of LD interlinks and that was designed with the needs of the library domain in mind. In order to remove some of the challenges experienced by librarians when working with LD, we also developed an accompanying graphical user-interface which was designed to be used by metadata experts rather than technical LD experts.
NAISC-L
NAISC-L stands for Novel Authoritative Interlinking for Semantic Web Cataloguing in Libraries. The word NAISC (pronounced noshk) is also the Irish word for links. The NAISC-L approach encompasses a LD interlinking framework, a provenance model and a graphical user-interface.
The NAISC-L interlinking framework is a cyclical, four-step method to creating an interlink (as outlined below in Figure 1).
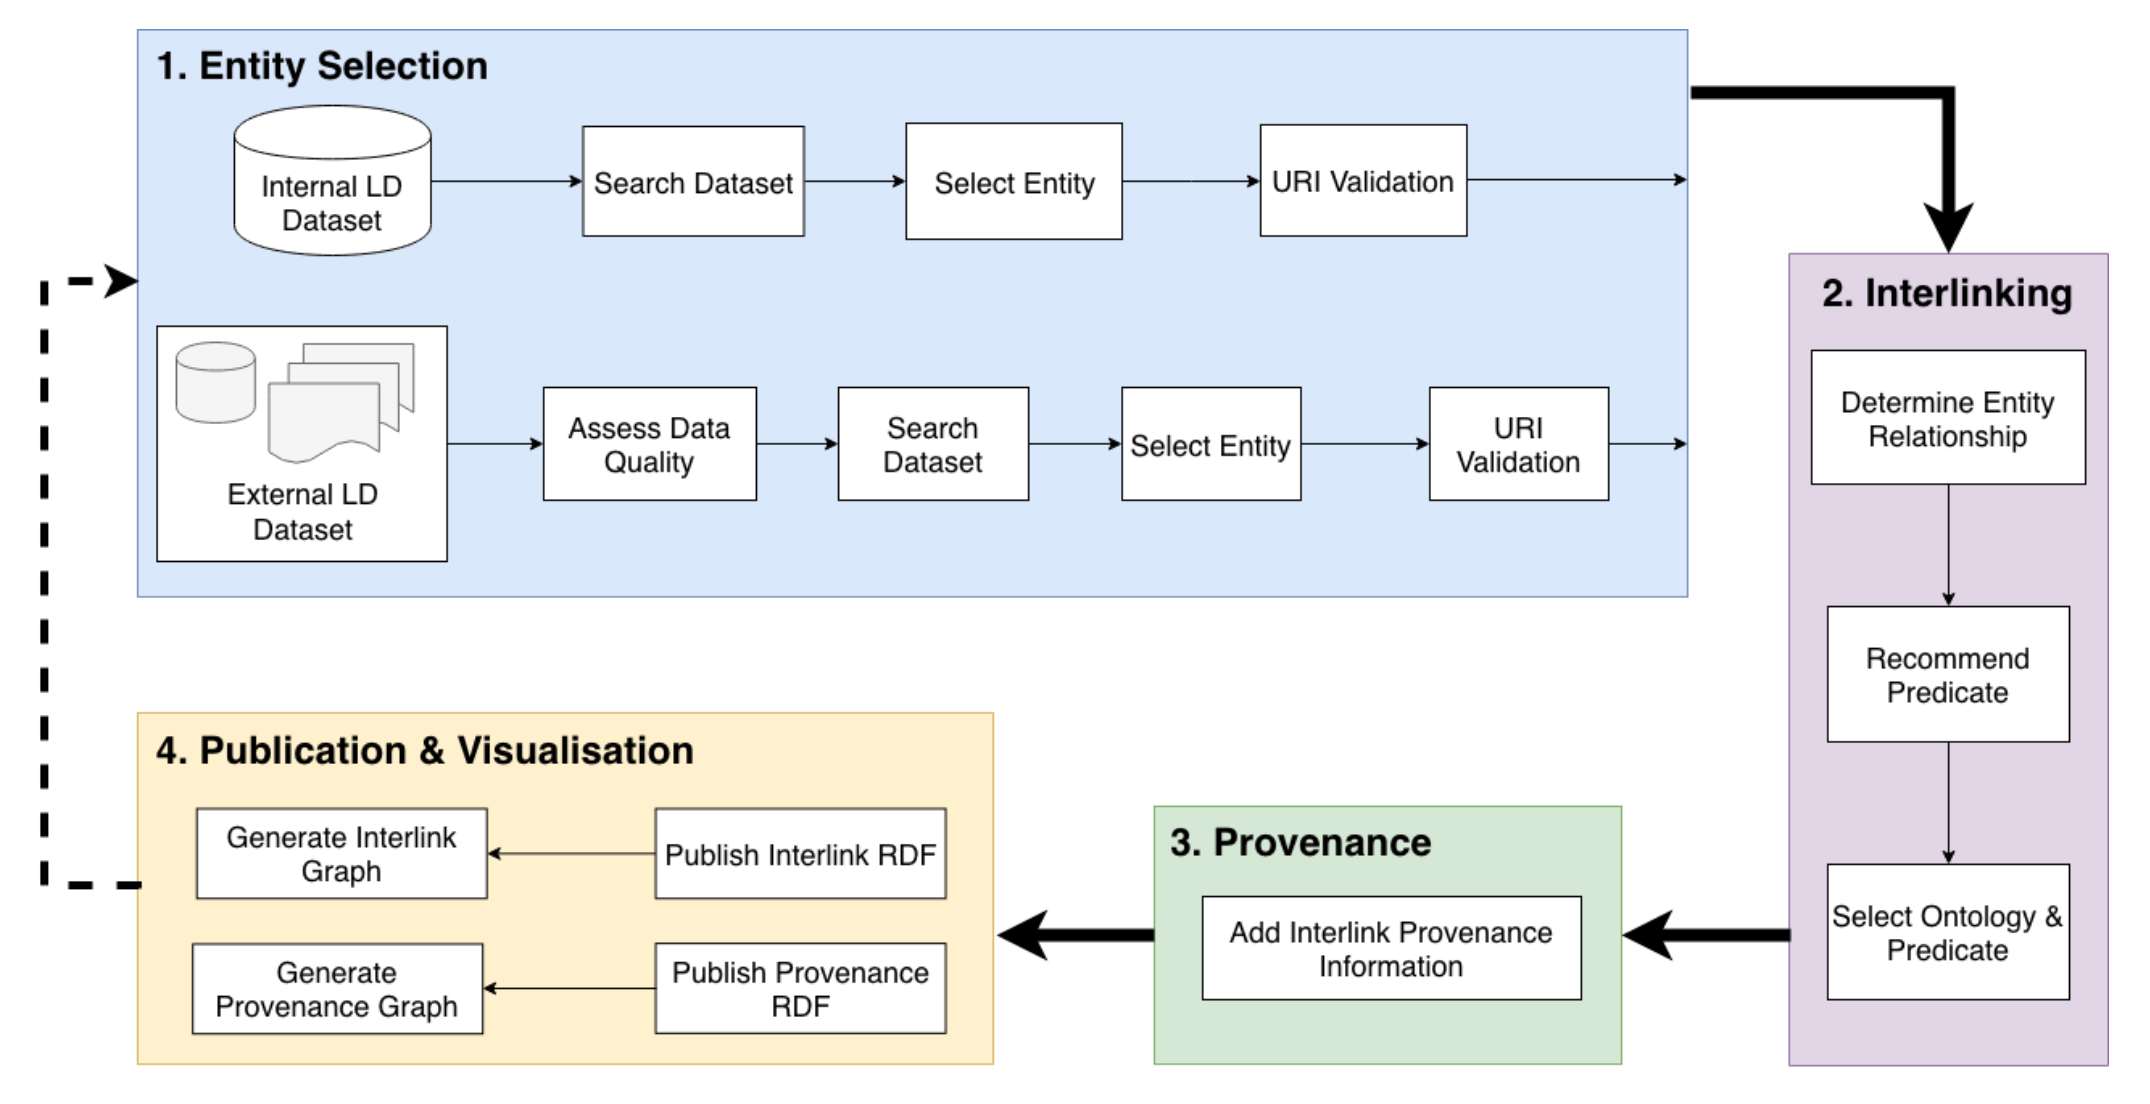
- Step 1: first requires the user to select entities, from an internal dataset, which they would like to create interlinks from. The user is then required to search for and select entities in external datasets which they would like to create interlinks to.
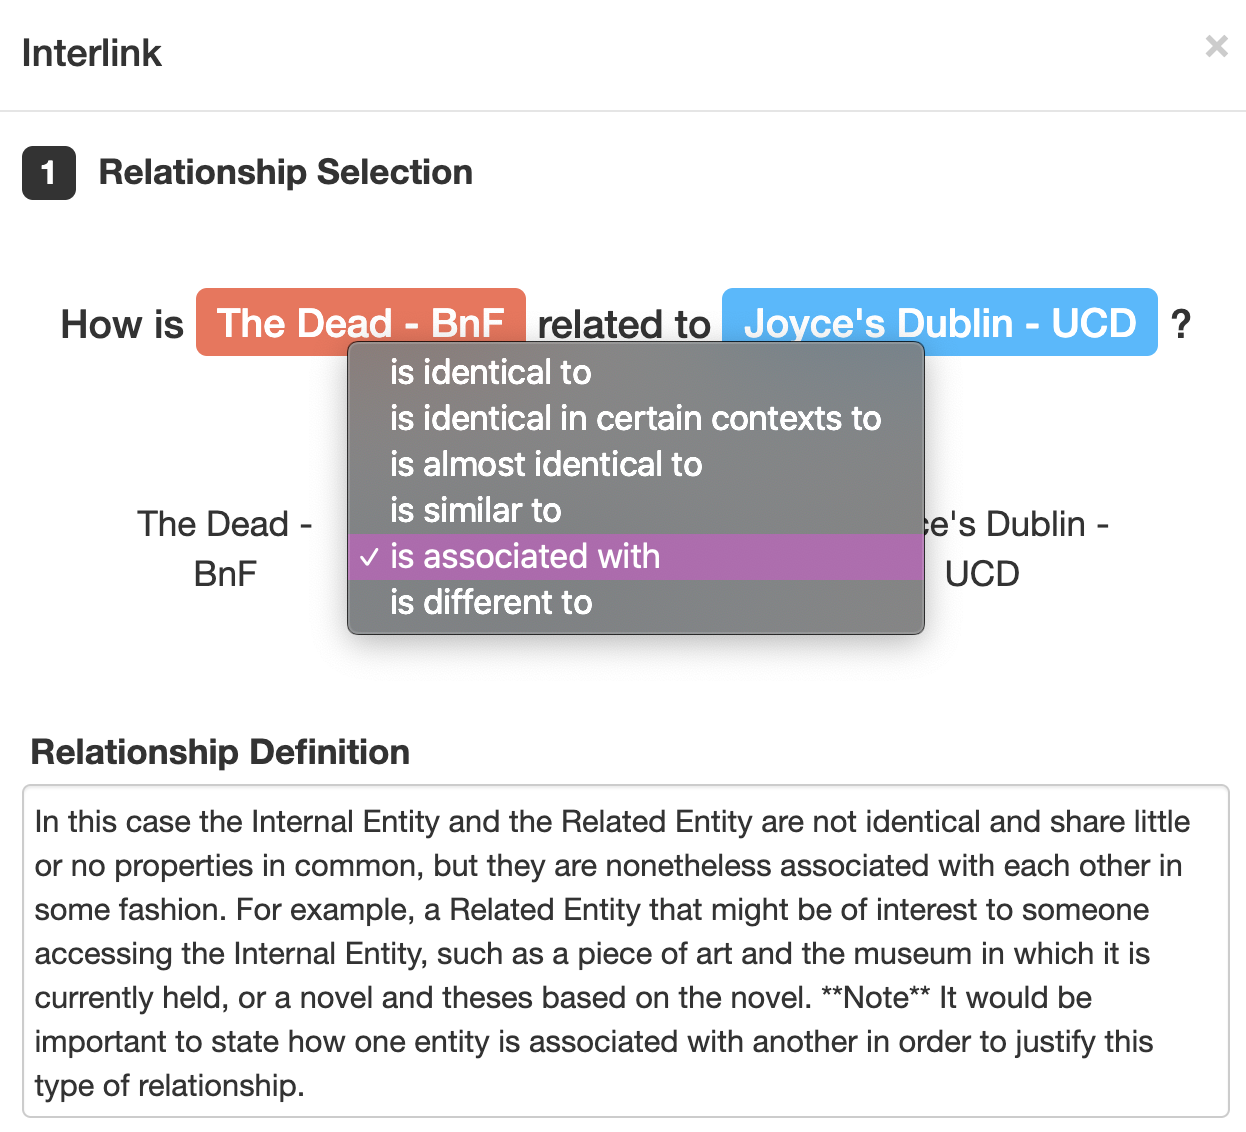
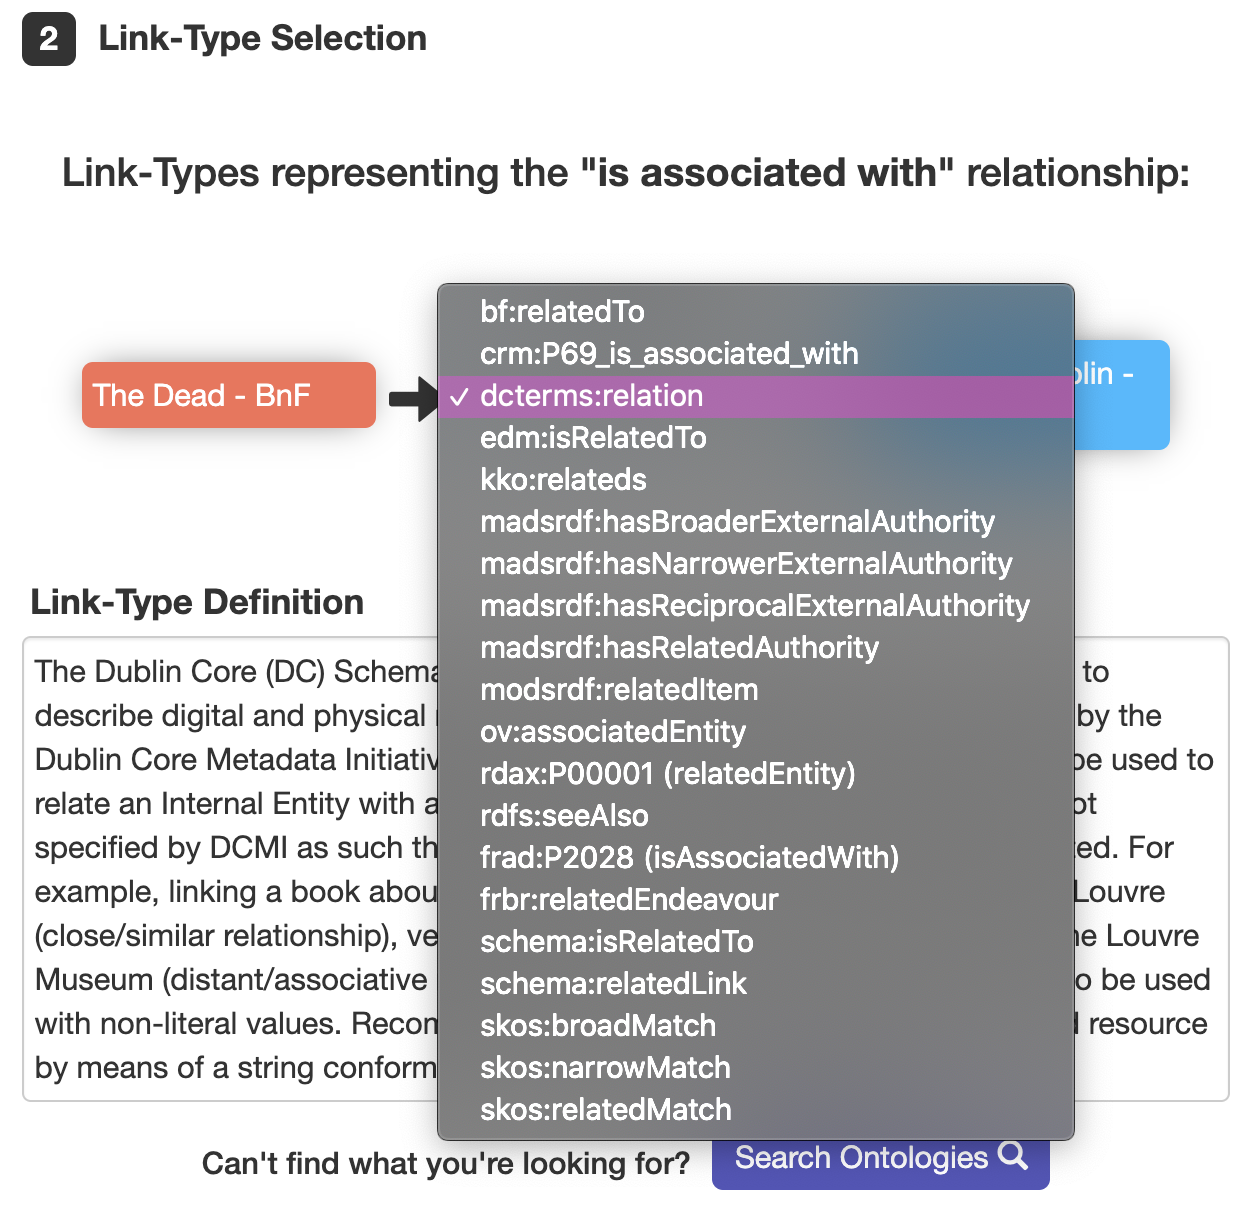
- Step 2: guides the user through the process of selecting a property/predicate that accurately describes the relationship between an internal and external entity, thus creating an interlink. This process first requires the user to determine the type of relationship between the two entities using a natural language term e.g. ‘is identical to’, ‘is similar to’, ‘is associated with’. Following this, the user is then presented with a list of properties/predicates which represent the selected relationship type. Using the provided property definitions and examples, the user is then guided to select the property most suitable for interlinking the entities.
- Step 3: involves the generation of provenance data, using the NAISC-L provenance model, that describes who, where, when, why and how an interlink was created.
- Step 4: involves the generation of the interlink and provenance RDF data.
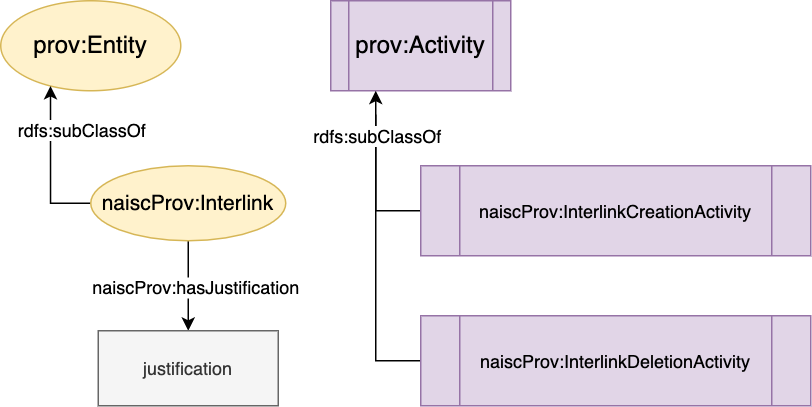
The NAISC-L provenance model uses PROV-O as its foundation as it is the W3C recommended standard for describing provenance data and because it can be easily extended for domain specific purposes. We used PROV-O to describe who, where and when an interlink was created. We then extended PROV-O to include interlinked specific sub-classes and properties. This extension, called NaiscProv (see Figure 2), is used to describe how and why interlinks were created.
The above framework and provenance model are accessible to the user via the NAISC-L graphical user-interface (GUI). The purpose of the GUI is to guide users through each of the steps outlined in the framework. An iterative user-centred design approach was followed in the creation of the GUI meaning that Information Professionals were involved in a series of cyclical tool design and testing phases.
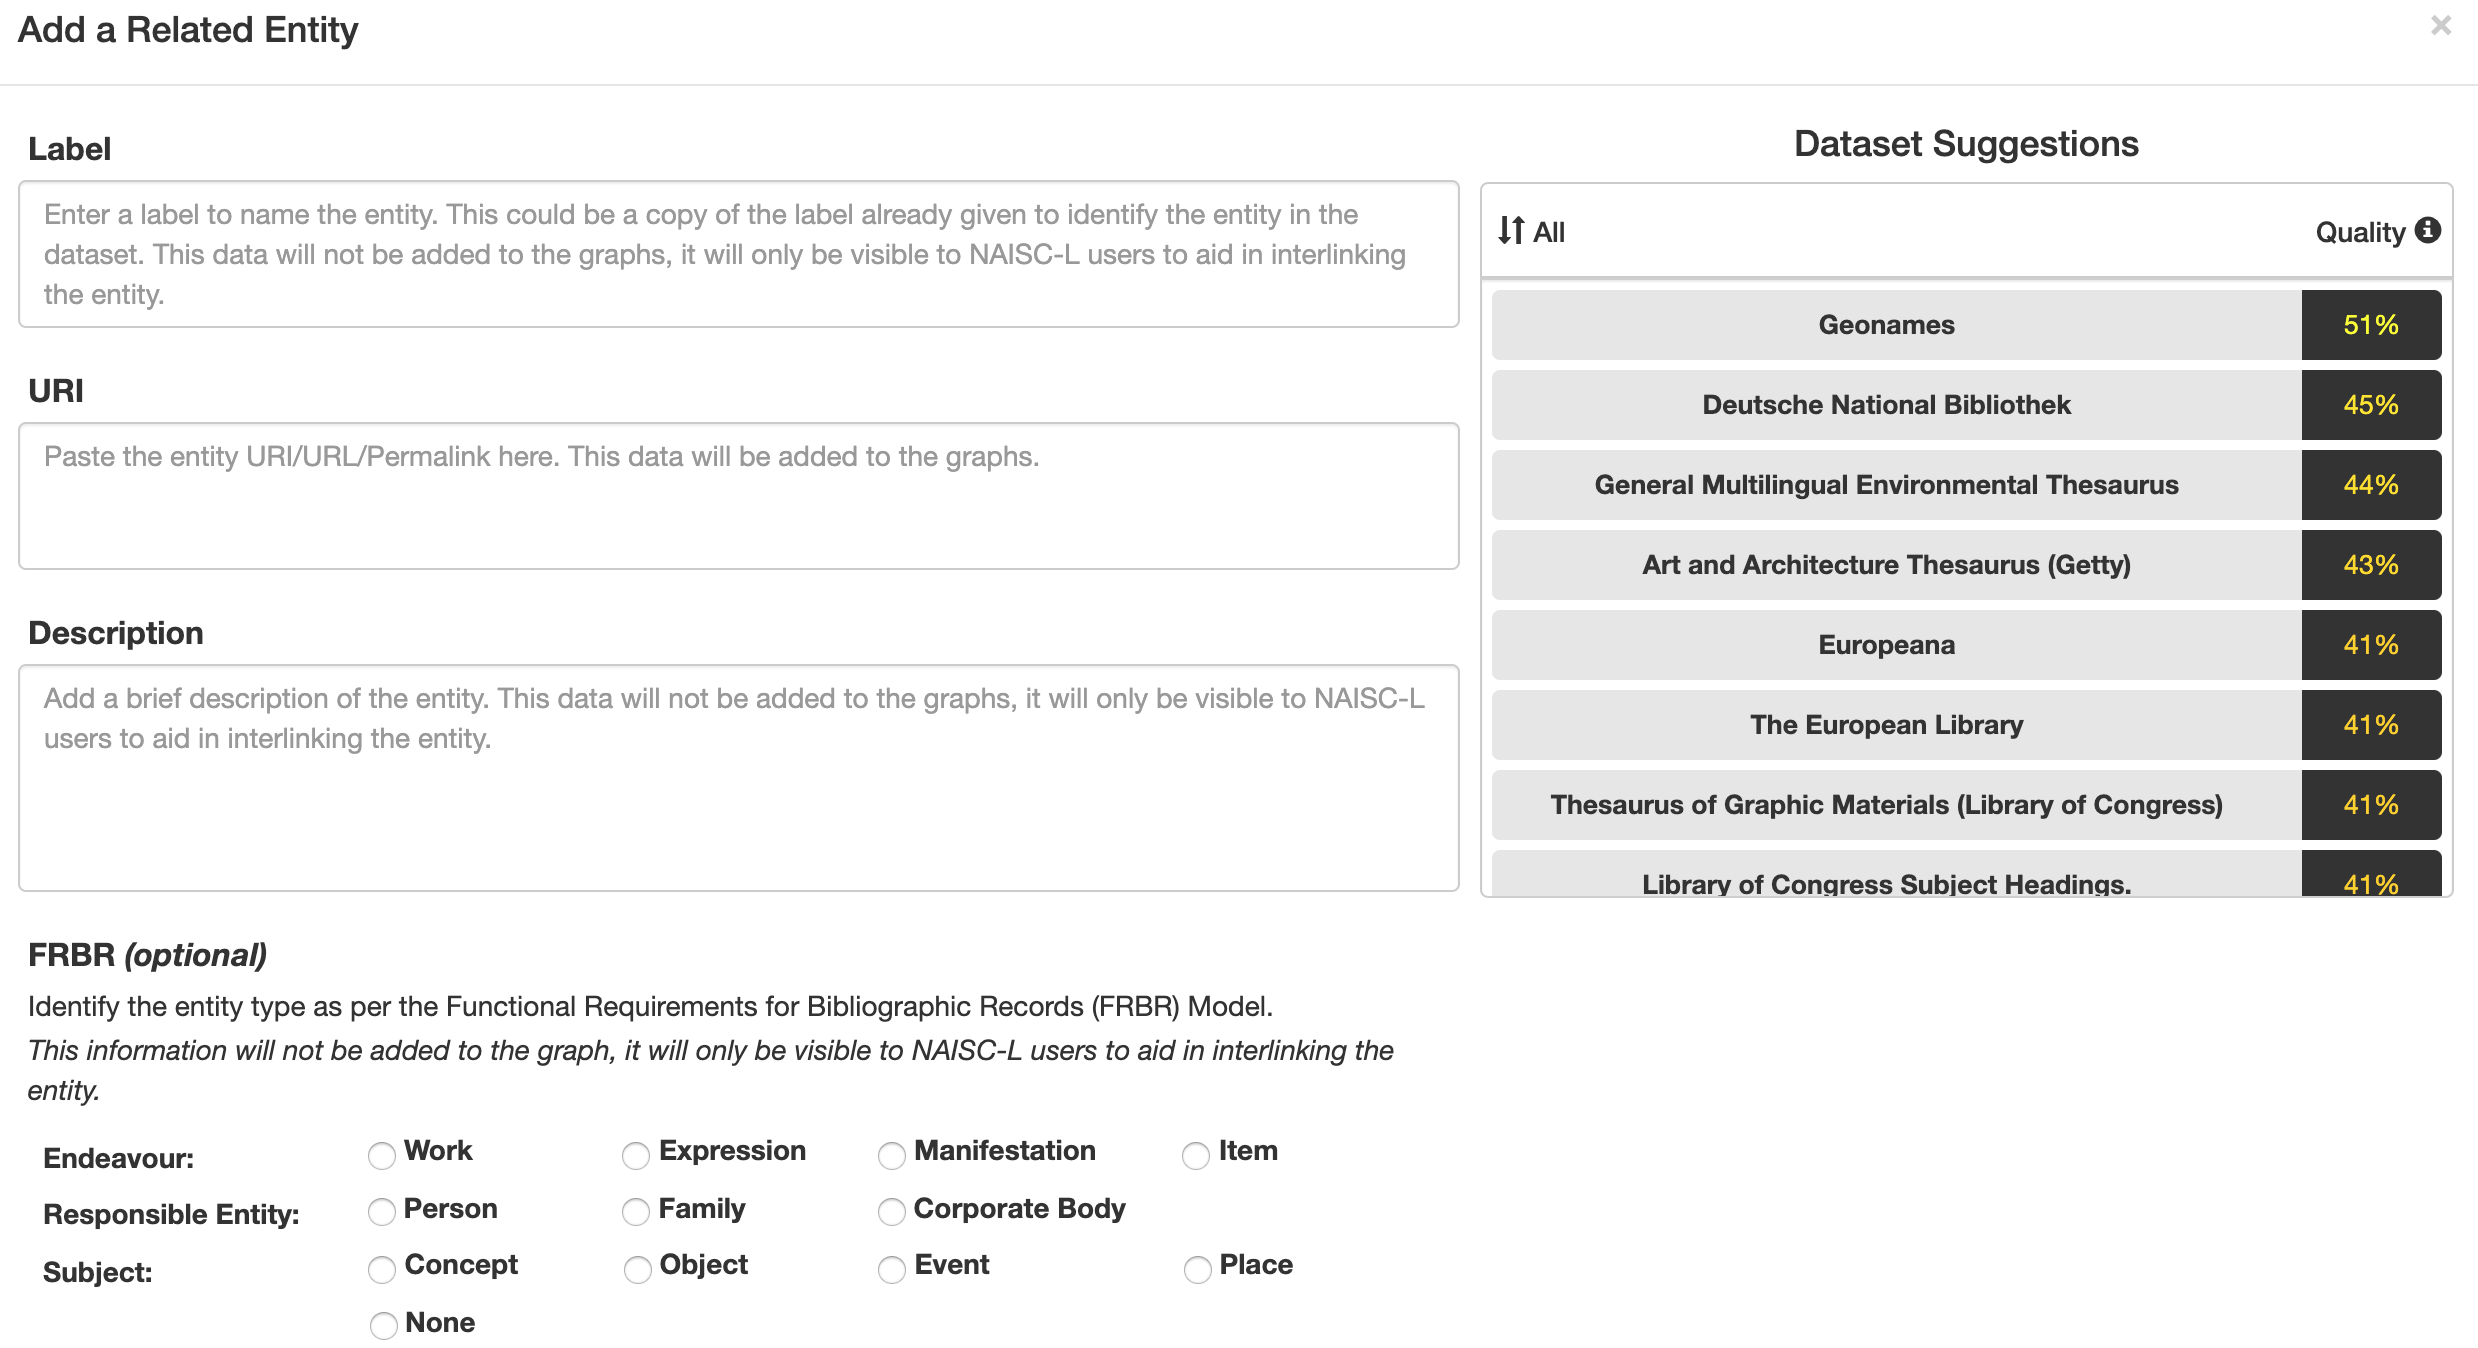
Step 1 of the framework is represented on the GUI similarly to the image in Figure 3 below. Here the user can enter a label, URI and a description of a particular entity. The user also has the option of describing the entity as per the Functional Requirements for Bibliographic Records (FRBR) model in order to aid in the interlinking process. In the case of selecting a Related Entity, the user is presented with a list of LD datasets in which they can search for a Related Entity. Each of LD datasets were given a quality score based on three quality metrics – Trustworthiness, Interoperability and Licensing. The datasets included in NAISC-L were selected based on the results of the 2017 survey, discussed above, from which a list of commonly used LD datasets was derived. As part of the same survey, participants were asked to select the evaluation criteria they apply when using/searching for external data sources, the results of which informed the quality metrics chosen for dataset analysis. The aim of providing this data quality score was to assist users in selecting high quality and authoritative resources to interlink with.
Part 2 of the framework is represented in a step-by-step process which guides the user in selecting the type of relationship type between a pair of entities (see Figure 4 and 5), followed by selecting a property which represents this relationship (see Figure 6).
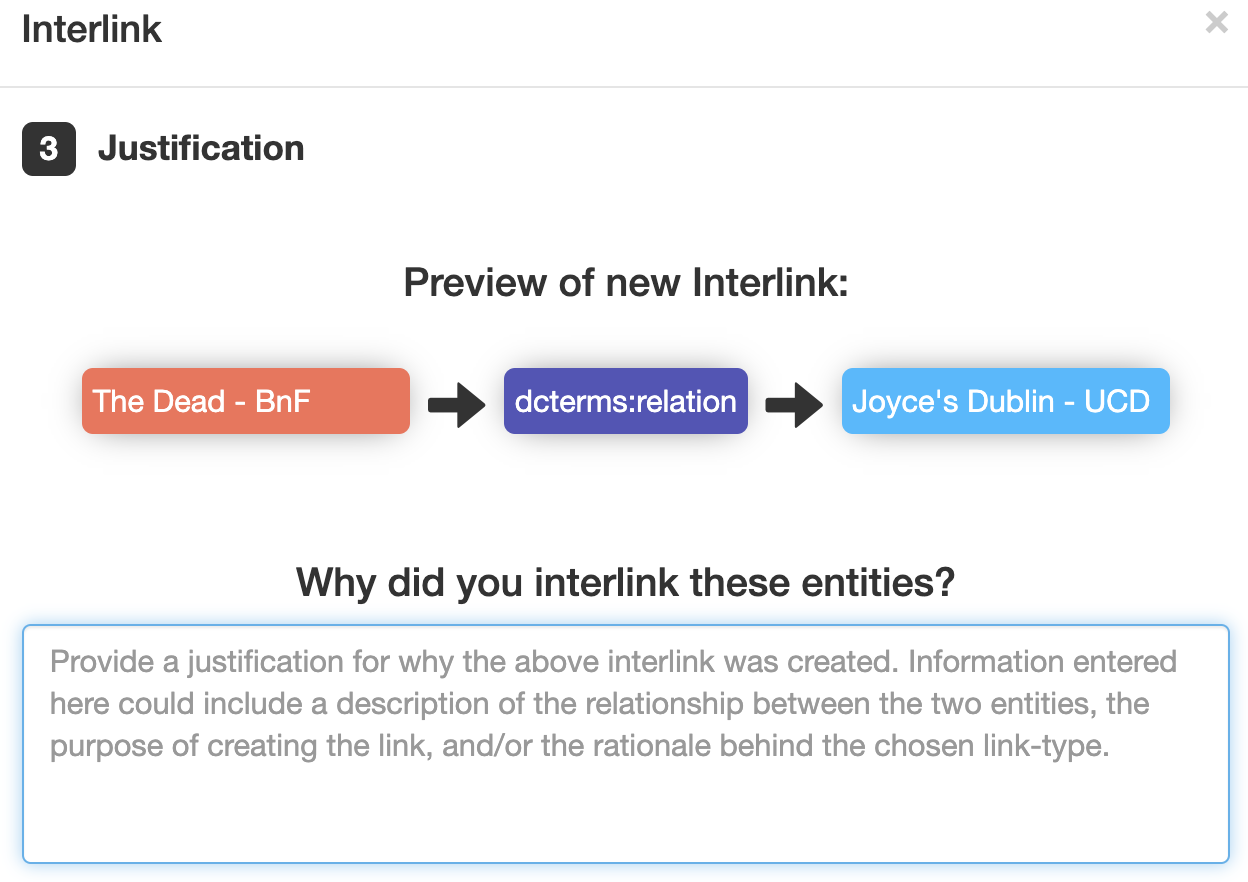
Step 3 of the framework is completed automatically by the tool (e.g. date, time, user), except, when creating an interlink the user is required to enter a justification for the link in order to provide the ‘why’ portion of the provenance model (see Figure 7).
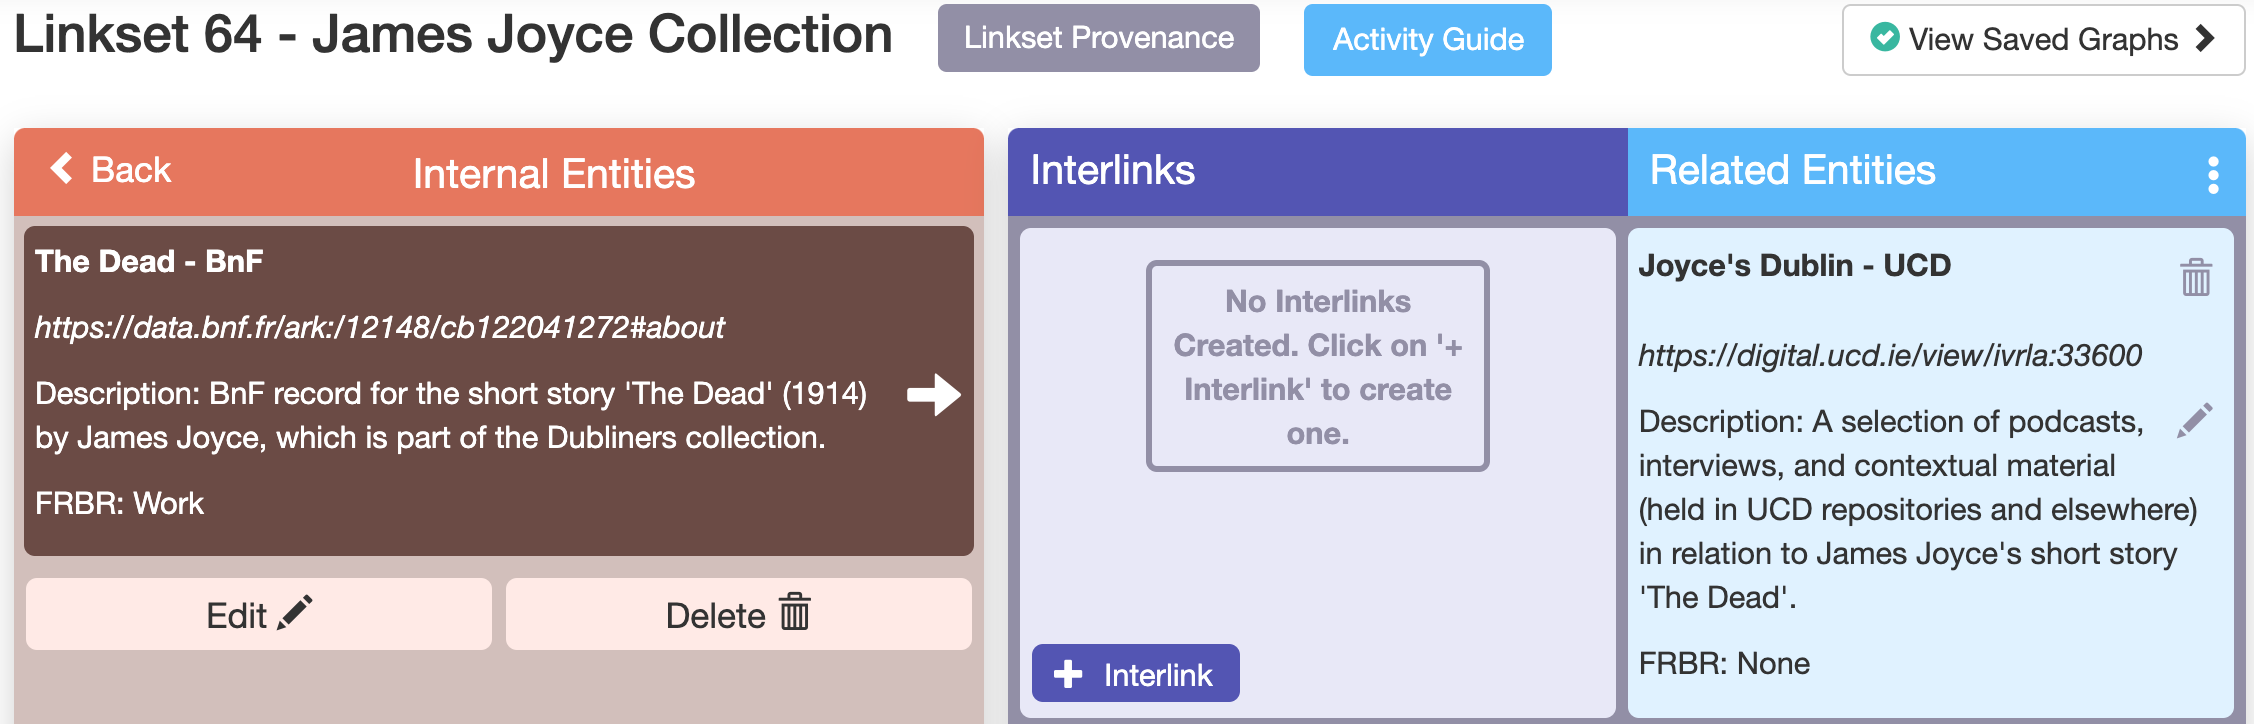
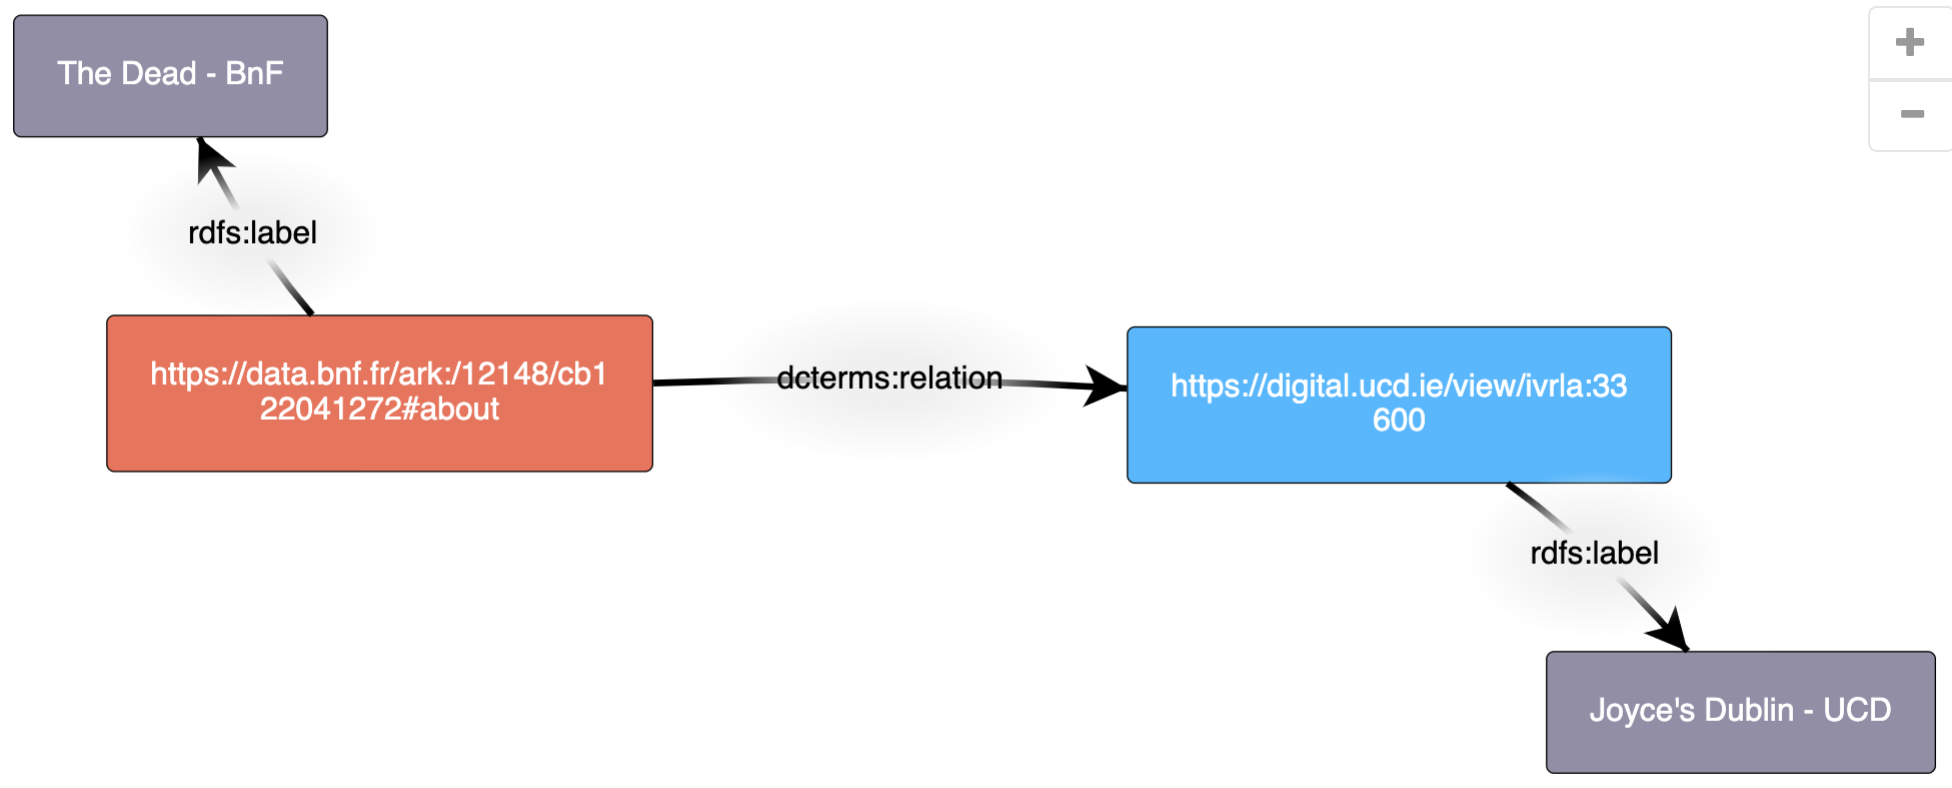
Step 4 of the framework is again completed automatically by the tool. The user is presented with an RDF graph and visualisation of the interlinks generated and their corresponding provenance data. Figure 8 below demonstrates a visualisation of a single interlink - in this case a link between the entity for James Joyce’s short story ‘The Dead’ held in the Bibliothèque national de France (BnF) to an entity for a collection of items related to the story held in the library of University College Dublin.
Using RDF Turtle syntax, Figure 9 below demonstrates the provenance of the interlink (*
- who (*prov:wasAttributedTo),
- what (*prov:wasAssociatedWith),
- where (*prov:actedOnBehalftOf),
- when (*prov:generatedAtTime),
- how (*prov:wasGeneratedBy)
- and why (*naiscProv:hasJustification)
Trialling NAISC-L at the Irish Traditional Music Archive
The Irish Traditional Music Archive (ITMA) holds a vast collection of materials relating to Irish traditional music, songs and dance. ITMA was recently involved in the LITMUS (Linked Irish Traditional Music) project which focused on the development of the first LD framework tailored to the needs of Irish traditional song, instrumental music, and dance. The project included the development of the LITMUS ontology to represent contemporary and historical Irish traditional music practice, documentation and performance, as well as the LD pilot project. This project involved using 20 years of TG4 Gradam Ceoil (Irish music awards) performance data in order to create a LD dataset which demonstrated the use of the LITMUS ontology and vocabularies.
Over one working week, three Information Professionals (IPs) at ITMA used NAISC-L for a short period each day in order to create a set of 30 interlinks. These interlinks created connections from some of the people/groups mentioned in TG4 Gradam Ceoil LD dataset to related entities in the Virtual International Authority File (VIAF), an OCLC-hosted name authority service. The aim of these interlinks was to provide authoritative information on specific individuals or groups, as well as to create links to other libraries which contributed to the VIAF record for these entities. Such links could be used to guide ITMA patrons to related resources held in other institutions and, in turn, direct VIAF users to data held at ITMA. The IPs who trialled NAISC-L found the framework and interlinking process to be engaging, functional and useful for their needs. The IPs were able to use NAISC-L as part of their cataloguing workflow and, even though the IPs had little to no prior experience with LD, all were able to successfully create interlinks.
Future Directions
During the NAISC-L trial at ITMA, some minor suggestions to improve the GUI were made by the IPs. Using this feedback, the GUI will be updated and, once complete, NAISC-L will be made available as an open access interlinking tool for libraries.
A demo of NAISC-L can be found @ https://www.scss.tcd.ie/~mckennl3/naisc/
References
[1] McKenna, L., Debruyne, C., & O'Sullivan, D. (2018). Understanding the Position of Information Professionals with regards to Linked Data: A survey of Libraries, Archives and Museums. In 2018 ACM/IEEE on Joint Conference on Digital Libraries (JCDL).
[2 ]McKenna, L., Debruyne, C., & O'Sullivan, D. (2019). NAISC: An Authoritative Linked Data Interlinking Approach for the Library Domain. In 2019 ACM/IEEE Joint Conference on Digital Libraries (JCDL).
[3] T. Berners-Lee, J. Hendler, and O. Lassila. 2001. The Semantic Web. Scientific American 284, 5 (2001), 1–5.
Digital Sources and Research Data: Linked and Usable
Esther Chen, Florian Kräutli, Max Planck Institute for the History of Science, Germany
Introduction
The Max Planck Institute for the History of Science can draw from a comparatively long history of digital scholarship, notably through its ECHO (Cultural Heritage Online) initiative that began to digitise historic sources and publish them on the web as early as 2002. Since then and continuing until the present day, research projects from various fields have been studying, annotating, and contextualising digital sources that have become increasingly available in recent years. In addition to common scholarly outputs such as books or journal articles, these projects produce digital outputs in the form of websites, databases or virtual exhibitions – typical artefacts of digital humanities research. Maintaining these artefacts has proven to be challenging: unlike their physical counterparts they do not end up in the library and instead live on scattered servers and ageing software systems. This makes maintaining long-term access to these resources difficult, and ensuring that they are usable and interoperable with evolving digital technologies nearly impossible.
MPG-DRIH: Our Solution to Securing Research Data and Restoring the Digital Research Lifecycle
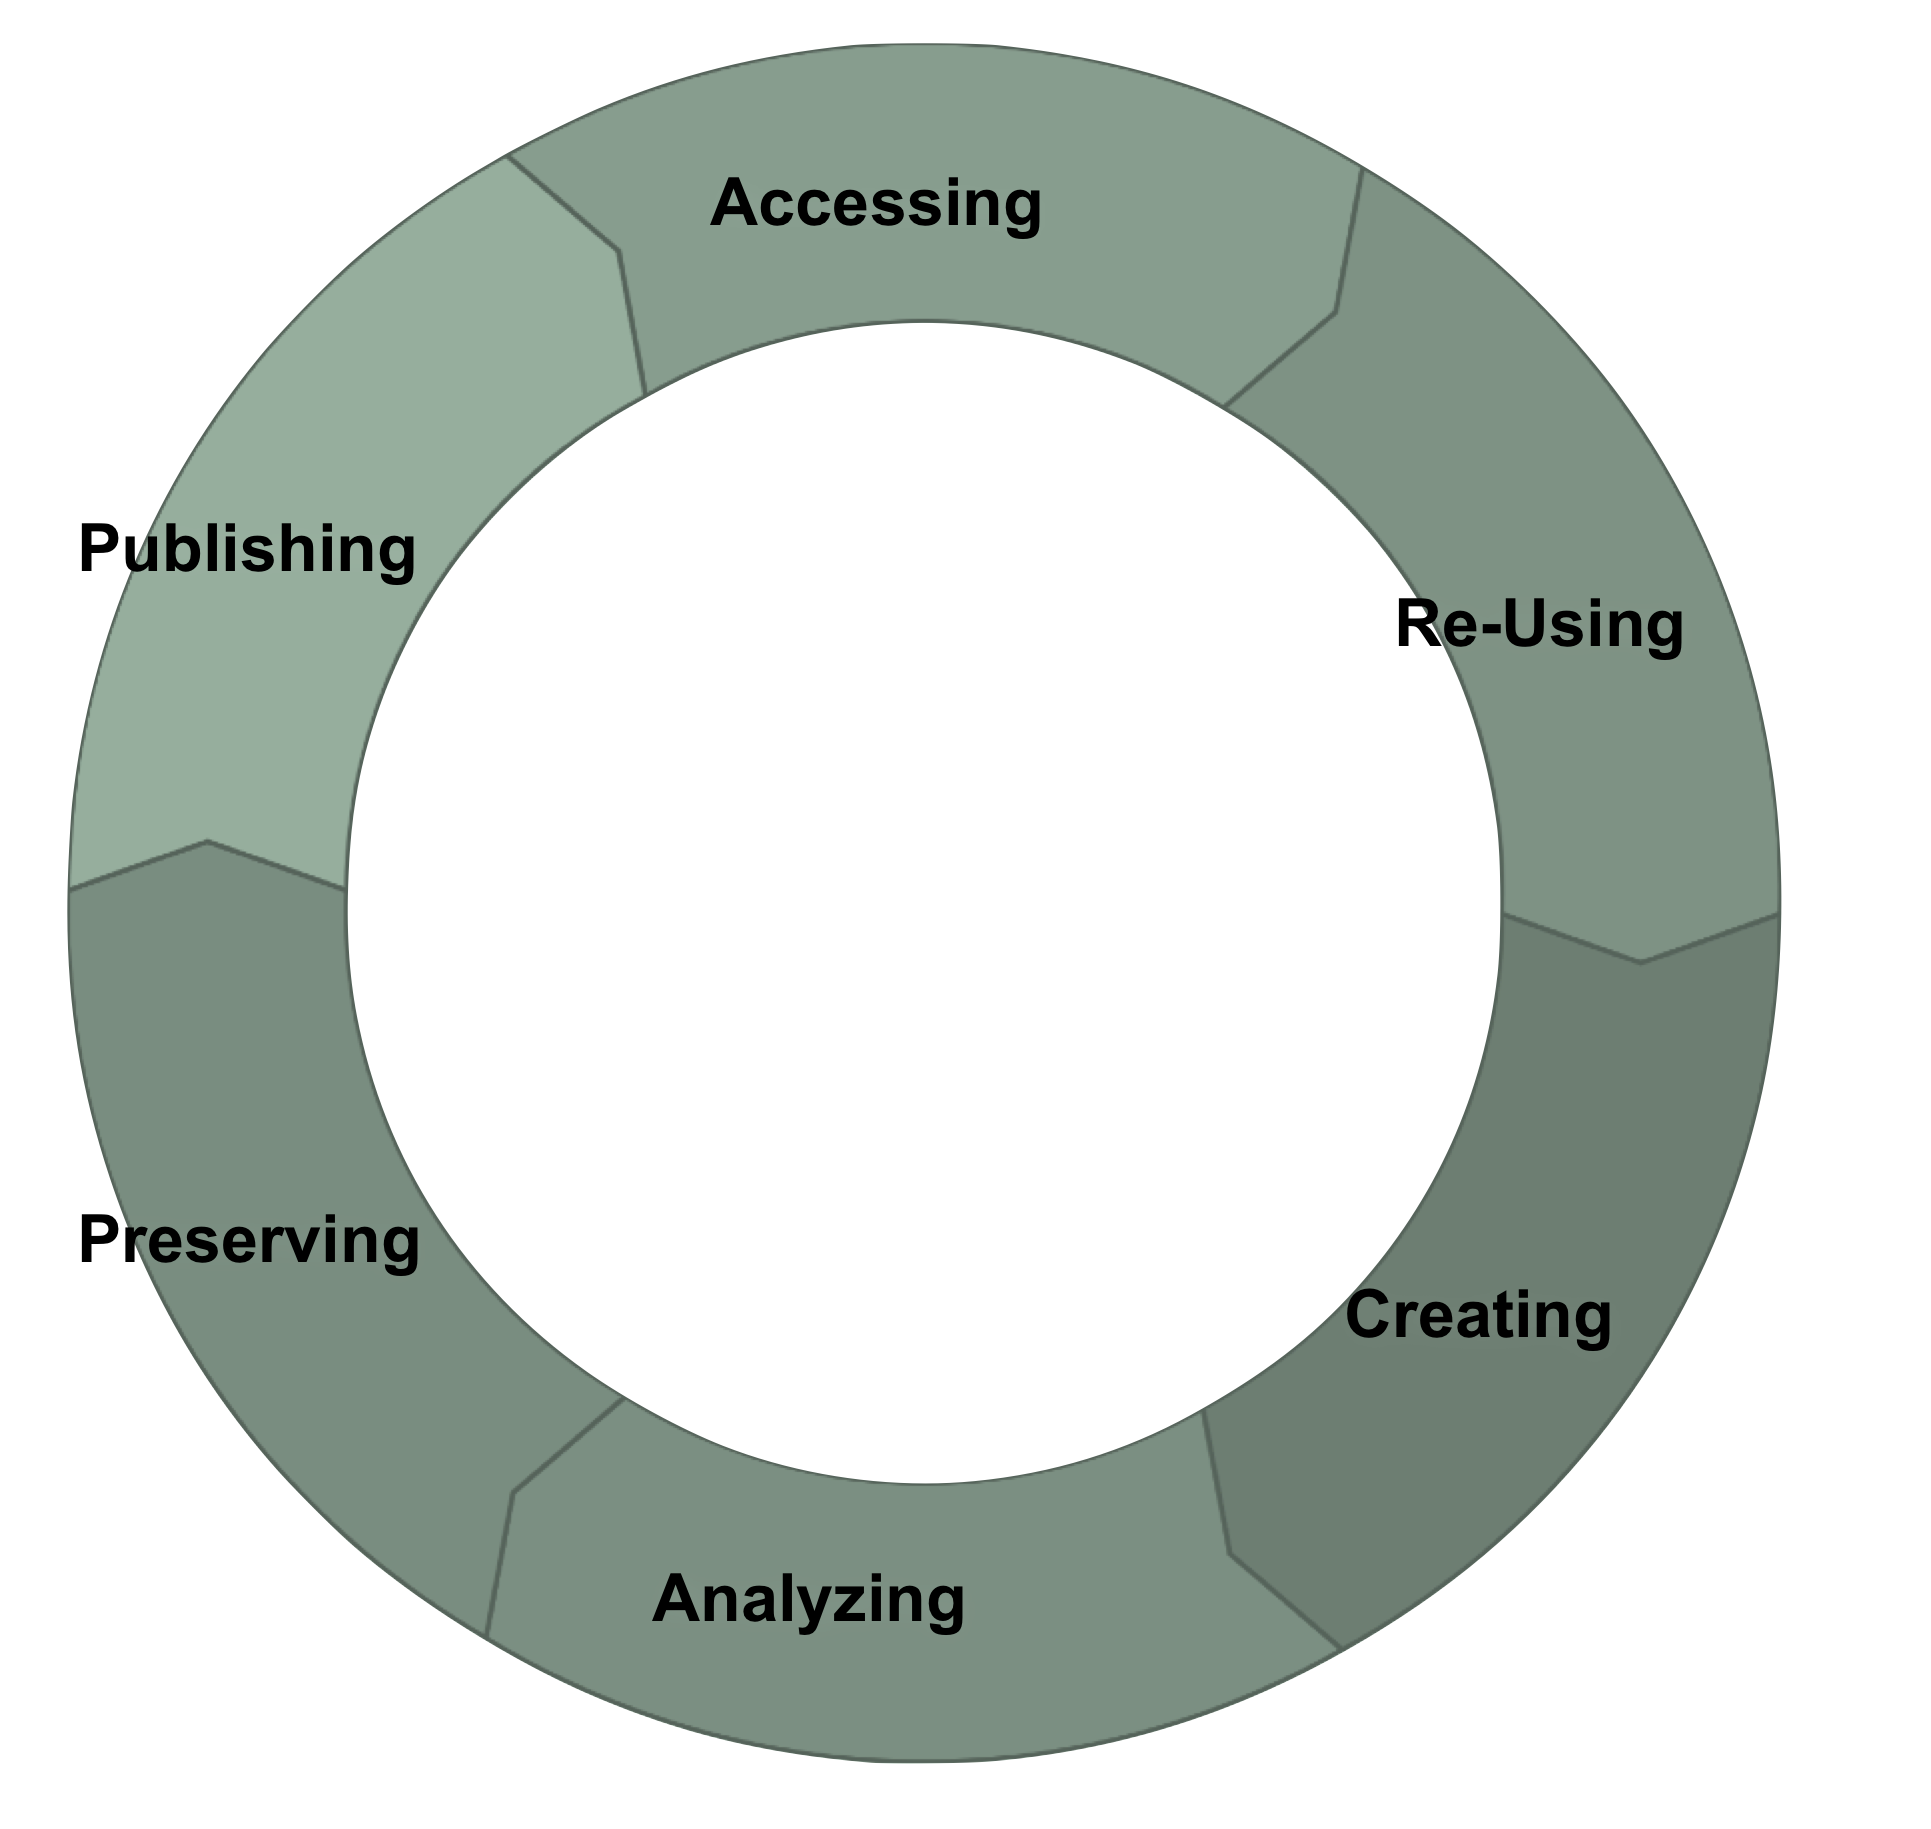
While natural and social sciences have been dealing with collecting and archiving research data for a long time, this term entered the humanities quite recently. Research data in the humanities in the form of published books (stored and catalogued in libraries) and unpublished paper collections (stored and often at least catalogued to a rough extent in archives) has remained stable over many decades. Scholars follow certain rules of citation and add bibliographic data to their work to make their research comprehensible and traceable. With the transition to a large variety of digital publication environments, and especially new formats of publication, this system changed and caused the previously well-functioning research lifecycle (Figure 1) to crack. The lifecycle works on the basis of scholarly publications, which build on existing publications and flow back into retrieval and archival systems. Libraries have reliably accumulated publications over centuries and thus secured the functioning of the research lifecycle.
Since research projects have become more digital, we face the growing challenge of digital research data produced by various projects at our institute and scattered across numerous websites and databases in different formats. The format of scholarly output is changing: currently this output does not necessarily flow back into any reliable information system that guarantees persistent data retrieval, and the research lifecycle as we know it from the print age is disrupted. A question that, in our opinion, is still under-addressed in the current and widely-led discussions about research data and suitable research data infrastructures for the humanities is: What kind of research data are we dealing with in the different disciplines? At the MPIWG we are dealing mostly with (digitised) books, articles, artefacts and archival sources. Research projects currently produce, besides publications in traditional formats such as papers and monographs, scholarly annotations in databases and websites, virtual exhibitions, podcasts and videos. When setting up new digital projects, researchers tend to “reinvent the wheel” over and over again. Due to a lack of technical standards we are often ending up with research data that is tied up with different (outdated) software, making it incompatible with each other, and which finally causes valuable data to vanish. Offering our researchers a suitable set of standards right from the start of their project is therefore one of our most important aims.
Our ambition with the digital research infrastructure MPG-DRIH is to close the digital research lifecycle: to make sure that digital research outputs can be discovered, accessed and reused. We achieve this through the adoption of a common model to represent our digital knowledge and the implementation of linked data technologies for data storage and exchange. About three years ago a team of librarians and IT researchers began to develop MPG-DRIH, a digital research infrastructure for the humanities to address an immediate need: the ability to maintain digital humanities research outputs in ways that they remain accessible and usable in the long term. The most important part of the philosophy guiding us through the project is to separate data from software. From the beginning we design the projects for end-of-life. Our aim is to retain the data, while we most likely will not be able to retain neither custom user interfaces nor ageing software.
Library, Research IT and Scholarly Projects – Building a Growing DH Framework through Fruitful Collaboration
The cooperation between library and research IT professionals in this project has proven very successful and has shaped a clearer vision of where in the framework of research data management future responsibilities, expertise and fields of work will have to be situated. Another crucial point for the successful development of our infrastructure is a close collaboration with humanities scholars: a close involvement of library and IT professionals in humanities research projects means they gain a thorough understanding of the kind of data that is produced as well as the requirements towards an infrastructure to store the data. In our experience, all sides benefit immensely from this collaboration. Exchanging ideas and expertise helps humanities scholars to develop their projects within a digital framework and to explore digital methods right from the beginning. Using – for example – controlled vocabularies early on opens up many more opportunities to explore data at a later stage. Using controlled vocabularies and digital research tools means not only adding a new lick of paint to the same result, but also has a noteworthy impact on the research process and methods themselves, leading them step-by-step towards genuine digital research: what has been understood for some time now under the term “digital humanities.”
At the same time the librarians gain significant new expertise: they extend their traditional fields of work and increasingly grow into the field of data modelling, becoming consultants for scholars when it comes to picking specific vocabularies and terms to model their data. Since librarians are experts in metadata, their development towards data modelling is quite clear; the significant difference is that their work now enters the research process at a much earlier stage. While in the print age librarians only started to produce metadata once the result of the research process was finished, they are now acting from the beginning and throughout the entire research process as consultants for data modelling. This enables librarians as well as IT professionals to ensure that the research data can be integrated into retrieval and archival systems once a research project ends.
Architecture and Tech Stack
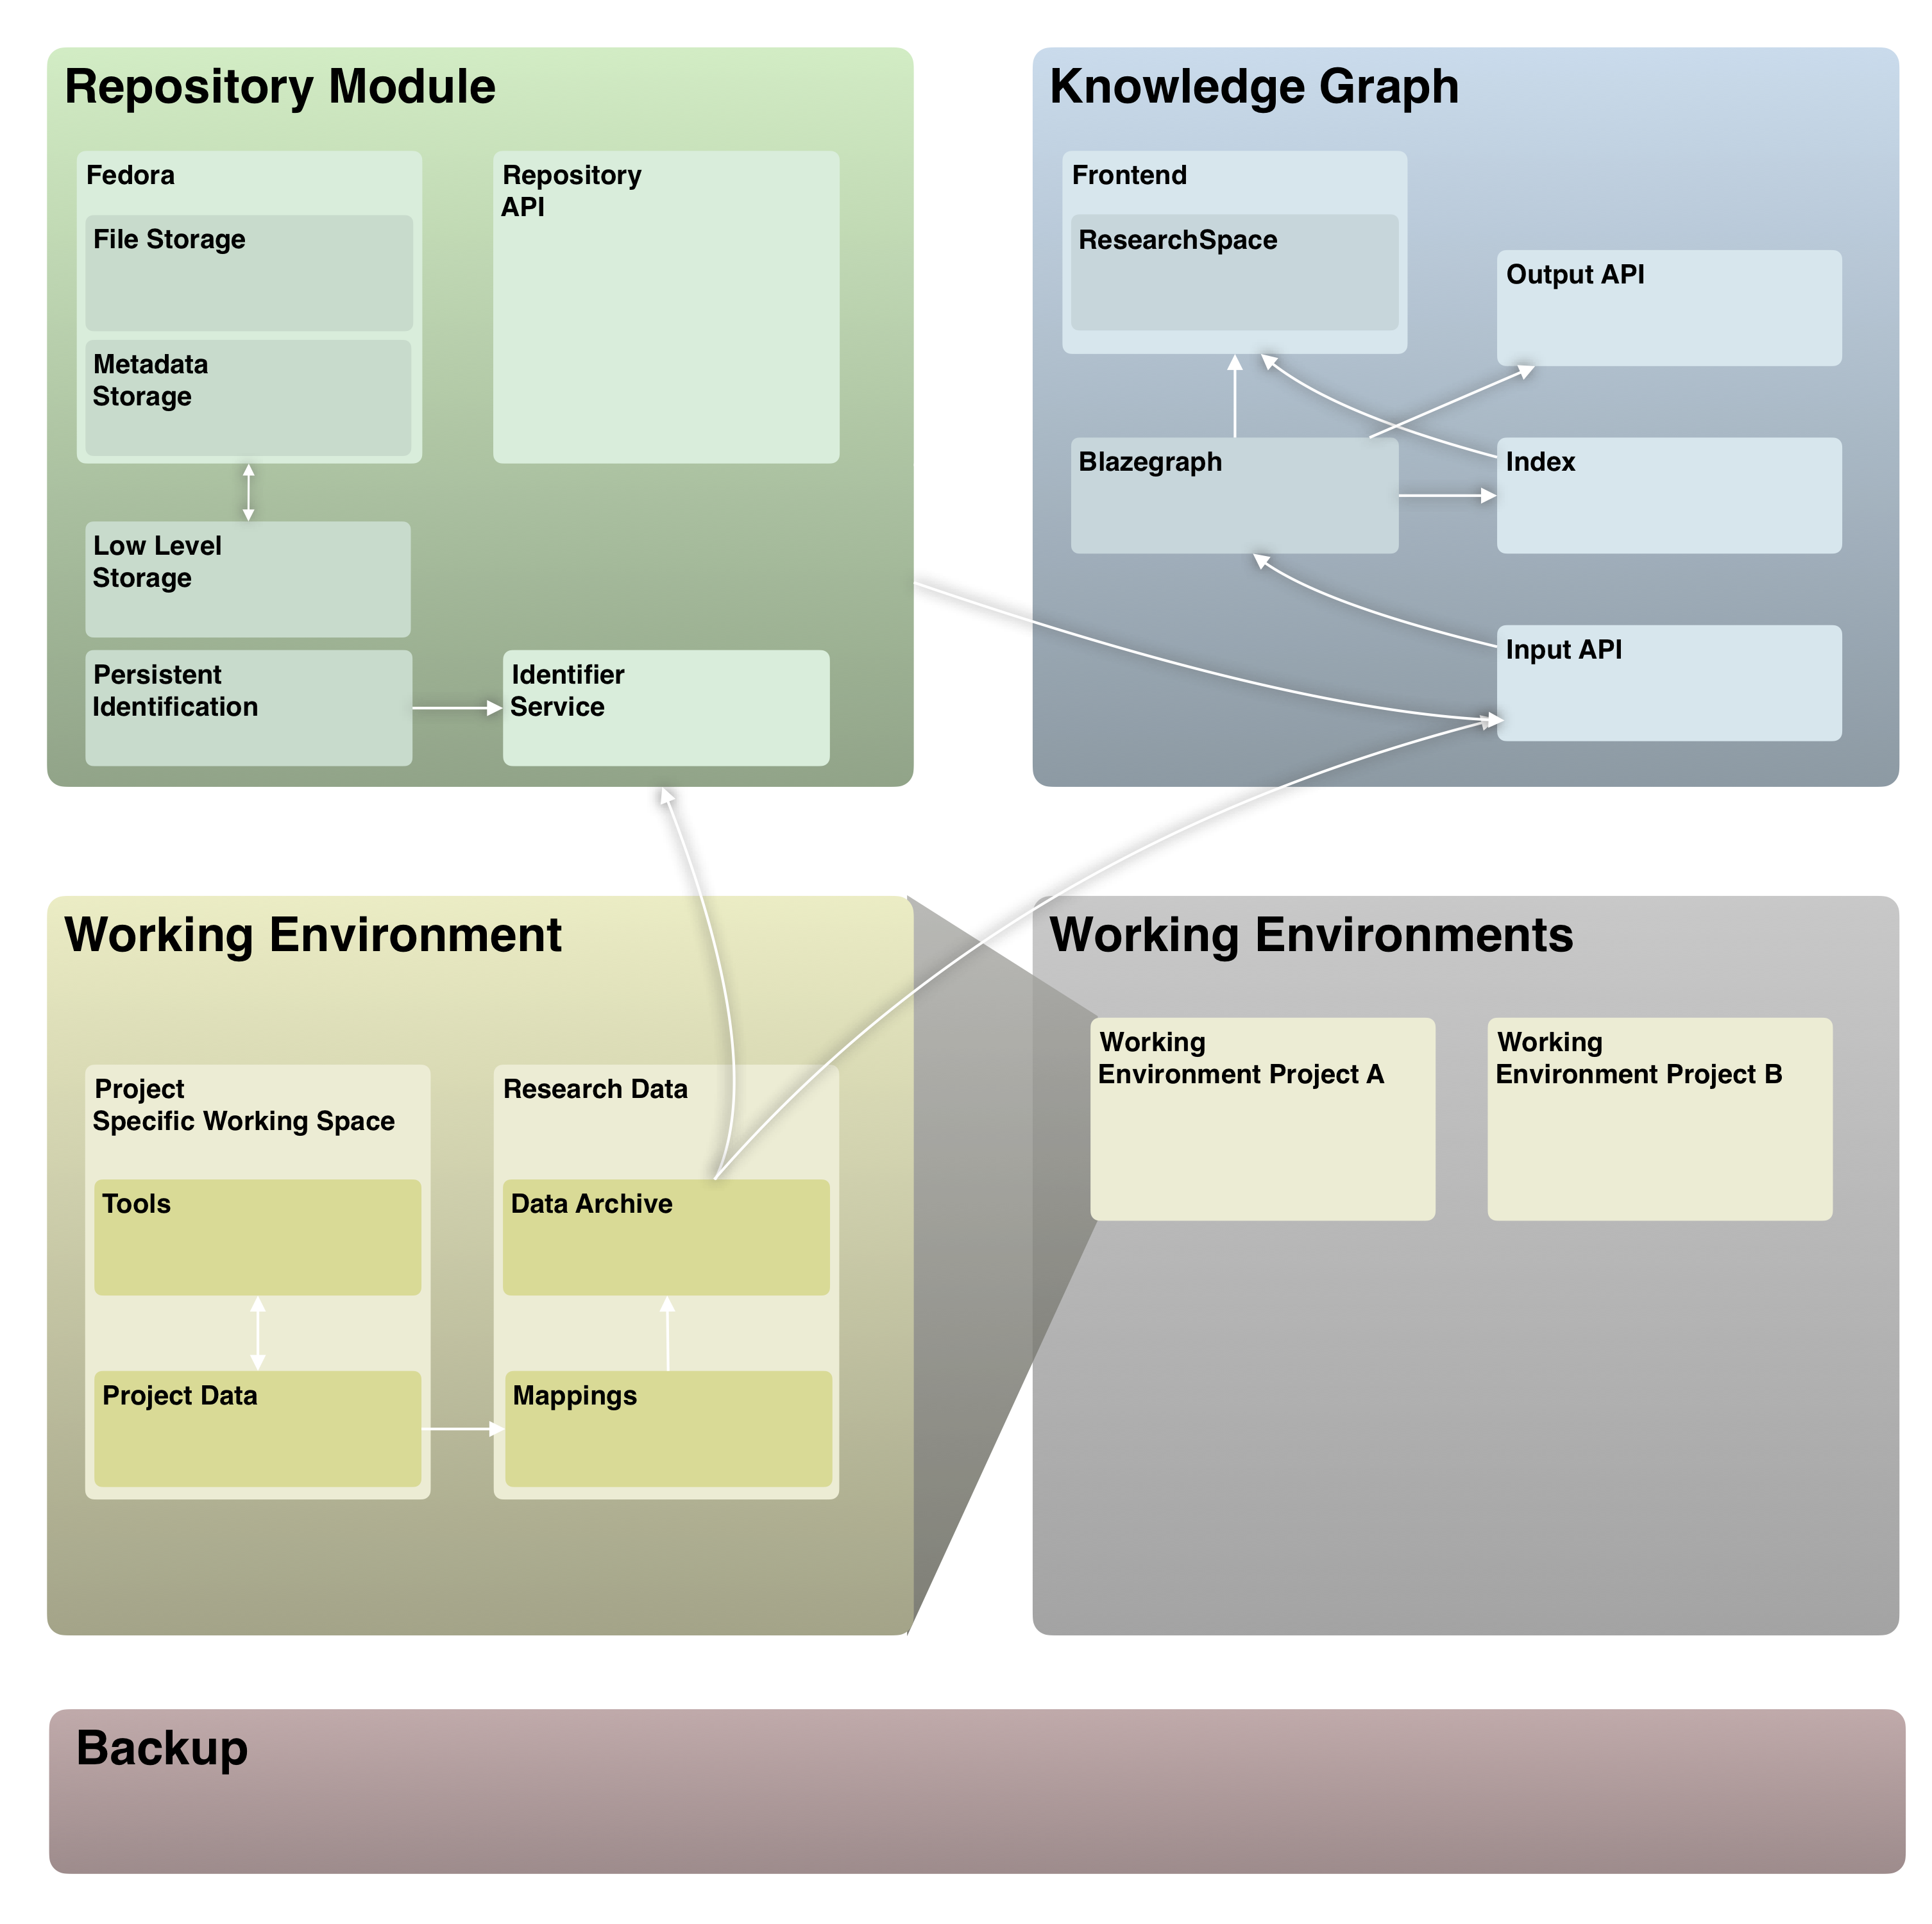
The architecture we developed for our infrastructure is comprised of three main components: a repository as a permanent storage for digital and digitised sources, working environments for scholars to conduct their digital research, and a knowledge graph (Figure 2). The repository implements tried and tested standard software such as Fedora Commons, as well as standard interfaces to resources, such as the image exchange API IIIF. The working environments contain two areas: the project-specific software environment and the data archive. While researchers are working on a project, they use specific software and custom interfaces that may not be usable and maintainable in the long term and which therefore will be switched off at the end of a project. What remains after a project has ended is the research data, which is stored in the data archive along with a mapping onto a common data model, which will then be ingested in the knowledge graph.
Through the knowledge graph we realise our vision of making all our digital artefacts – be they sources, annotations or entire research databases – centrally accessible and usable. The system is not specific to our use case but has from the start been developed in exchange with other Max Planck Institutes who will themselves adopt the system and contribute their research data to an inter-institutional knowledge graph. Key challenges are to bring data from various sources together in ways that retain the original context and detail, and to provide users with an environment in which they are able to make sense of this vast information resource.
A knowledge graph in our use-case is a means of storing data in a way that is interlinked and semantically meaningful. The interlinking is based on the principle of linked data, a concept coined by the inventor of the World Wide Web Tim Berners Lee. Instead of linking webpages through hyperlinks, which is how the web still largely operates, linked data connects individual pieces of data. To achieve this, every single piece of data needs to be made identifiable through a Uniform Resource Identifier (URI). This makes linked data immensely useful for our research lifecycle because it allows scholars to reference not only books and documents, but also datasets and even individual data points. Many resources are already linkable through URIs. The Virtual International Authority File (VIAF) for example provides identifiers for persons, works and locations, among other things, and Wikidata as an open structured knowledge base contains identifiers for almost anything. This means that for many things researchers need not to invent new identifiers, but can link to existing references, which in turn connects their research outputs to a growing linked data cloud.
Linking to references is also one building block of what we mean by our knowledge graph being semantically meaningful. By linking to an authority record on, for example, Paris (the city), a researcher can make evident that they are not talking about Paris (the mythological figure), or vice versa. What is often implicitly evident for humans, or can be described in written publications, needs to be made explicit in digital data. This is especially the case when data needs to live on its own, separate from software interfaces that might provide context to human users. We address this challenge by harmonising all input data to a common model with which we can, to a certain degree, represent the complexity of humanities research data: CIDOC-CRM, a reference model for harmonising cultural heritage data. Besides providing classes for common types of entities such as persons or places, CIDOC-CRM formulates a language for describing events and processes. In the humanities and especially in history we cannot take for granted that certain terms and processes are universally understood and remain constant. For example, an author of a 12th-century manuscript has little in common with an author of a present-day publication. The processes of writing and book production, and what we are able to know about them, are strikingly different. Using CIDOC-CRM we can represent an author of a manuscript not by using the term 'author', but by modelling the processes of the creation of a text according to our understanding that we are able to derive from historic sources.
This means that our knowledge graph becomes extremely detailed – it has to be in order to store what we need it to – but at the same time rather complex to navigate. To make such a rich graph usable, we implement a user interface built on ResearchSpace, a software system based on the semantic data platform Metaphacts Open Source Platform. ResearchSpace implements a search interface that operates on an additional abstraction of the data that represents all entities and processes on a small set of fundamental categories and relations [2]. The author of a 12th-century manuscript may then be found by simply searching for the 'creator' of a 'thing', while the detailed description remains accessible.
To evaluate the feasibility of our approach, we have successfully implemented a pilot [1], which is accessible online. We started to implement the entire system together with our partners in September 2018 and are currently deploying the first version of it at our institute.
References
[1] Kräutli, F. and Valleriani, M., 2018. CorpusTracer: A CIDOC database for tracing knowledge networks. Digital Scholarship in the Humanities, 33(2), pp.336–346.
[2] Tzompanaki, K. and Doerr, M., 2012. A new framework for querying semantic networks. Institute of Computer Science, F.O.R.T.H. Crete–Greece.
Design for Simple Application Profiles
Tom Baker, DCMI; Karen Coyle, Consultant
Background
The application profile (AP) has been a defining feature of Dubin Core-style metadata since the early years of the Dublin Core Metadata Initiative. "Application profile" was defined in 1999 as a schema with "elements drawn from one or more namespaces, combined together by implementors, and optimised for a particular local application".
In practice, profiles take many forms with respect to base vocabularies and to other profiles. Some profiles are subsets of a vocabulary (or of another profile), while others are supersets. Some profiles use terms from a single namespace while others "mix-and-match" terms from multiple namespaces. Some profiles are expressed in HTML, PDF, or spreadsheets for human consumption, while others are coded in database, programming or schema languages for machine processing. In practice, profiles have a wide range of uses:
- To document community consensus.
- As templates for creating data.
- For analyzing or validating data.
- For merging or selecting data from multiple sources.
- For ingesting data from others.
- For retrieving or displaying different views of data.
In the mid-2000s there was a push to formalize the model for application profiles, or "description set profiles", on the basis of a DCMI Abstract Model and to encourage the documentation of profiles with functional requirements, domain models, and user guides the Singapore Framework for Dublin Core Application Profiles. In 2008, a draft Description Set Profile Constraint Language DC-DSP proposed a language for expressing application profiles as sets of templates that could be matched against instance data to validate conformance.
These specifications achieved little traction among metadata implementers due, in large part, to their strong basis in RDF, which at the time was itself only just getting traction in the form of Linked Data. A W3C workshop in 2013 reviewed existing approaches, including DC-DSP, and led to the finalization of Shape Expressions ShEx and Shapes Constraint Language SHACL -- powerful and expressive schema languages that superseded the simpler DC-DSP.
A Simple Tabular Model for Application Profiles
Since 2019, the DCMI Application Profiles Interest Group (DCAP-IG) has revisited the DC-DSP model but from a different angle. The goal now has been to enable "spreadsheet-enabled" non-experts -- people who are more comfortable with Excel or Apple Numbers than with XML, SHACL, ShEx, or Python -- to create application profiles in a simple tabular format that can be used to generate actionable validation schemas. The first iteration of this Simple Tabular Model for Application Profiles (AP-STM) was presented at SWIB19, and in 2020, the Interest Group continues to discuss variant prototypes of this model.
The simple tabular model is being designed to support:
- The most common and basic use cases for profiles.
- The creation of profiles in a tabular format by the "spreadsheet-enabled".
- Conversion into PDF or HTML for human consumption.
- Conversion into validation schemas in XML, SHACL, or ShEx.
- Use, when required, as a stepping stone to more complex profiles expressed in schema languages.
- Simple documentation for users in multiple languages.
Design choices
Ideally, the Simple Tabular Model should be simple enough without being too simple. Issues and tasks that are still open as of April 2020 include:
- Defining a small vocabulary of column headings in plain language that makes sense to non-experts.
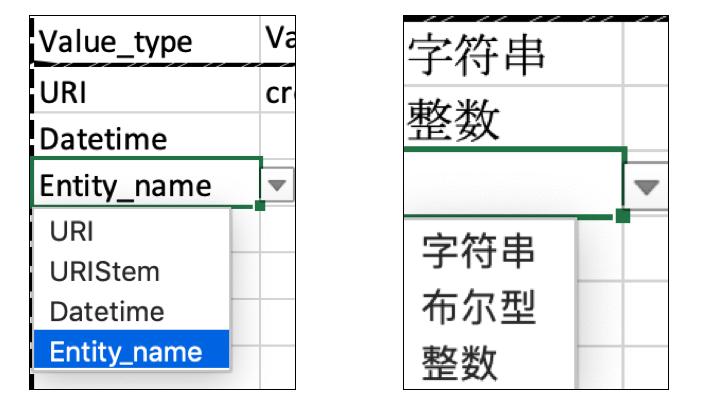
- Defining a core vocabulary of value types such as Literal, IRI, IRI Stem (base URI), Pick List... (see illustration below).
- Clarifying how value constraints can be expressed in (ideally) no more than two columns (e.g., value type `IRI Stem` plus value `http://aims.fao.org/aos/agrovoc/`).
- If the AP-STM model is to conform to the RFC 4180 format for Comma-Separated Values (CSV), which does not support tabbed spreadsheets, deciding whether namespace prefixes should be declared in additional columns or separate files.
Documentation of the model will need to include:
- AP-STM Model specification, defining the structure of templates and terminology used.
- Example AP-STM instances: CSV files filled in with constraints used for describing specific types of thing, such as paintings or books.
- Examples of validation schemas in XML Schema, SHACL, or ShEx generated from the AP-STM instances.
- Conversion scripts, such as Python programs for generating ShEx schemas from CSV files.
- Example instance data validatable by the example schemas.
Wikidata entity schema example
The example presented at SWIB19 is a small proof of concept that shows the simple tabular format being used to produce Wikidata entity schemas. Entity schemas are small ShEx documents that permit the validation of Wikidata entities and their properties.
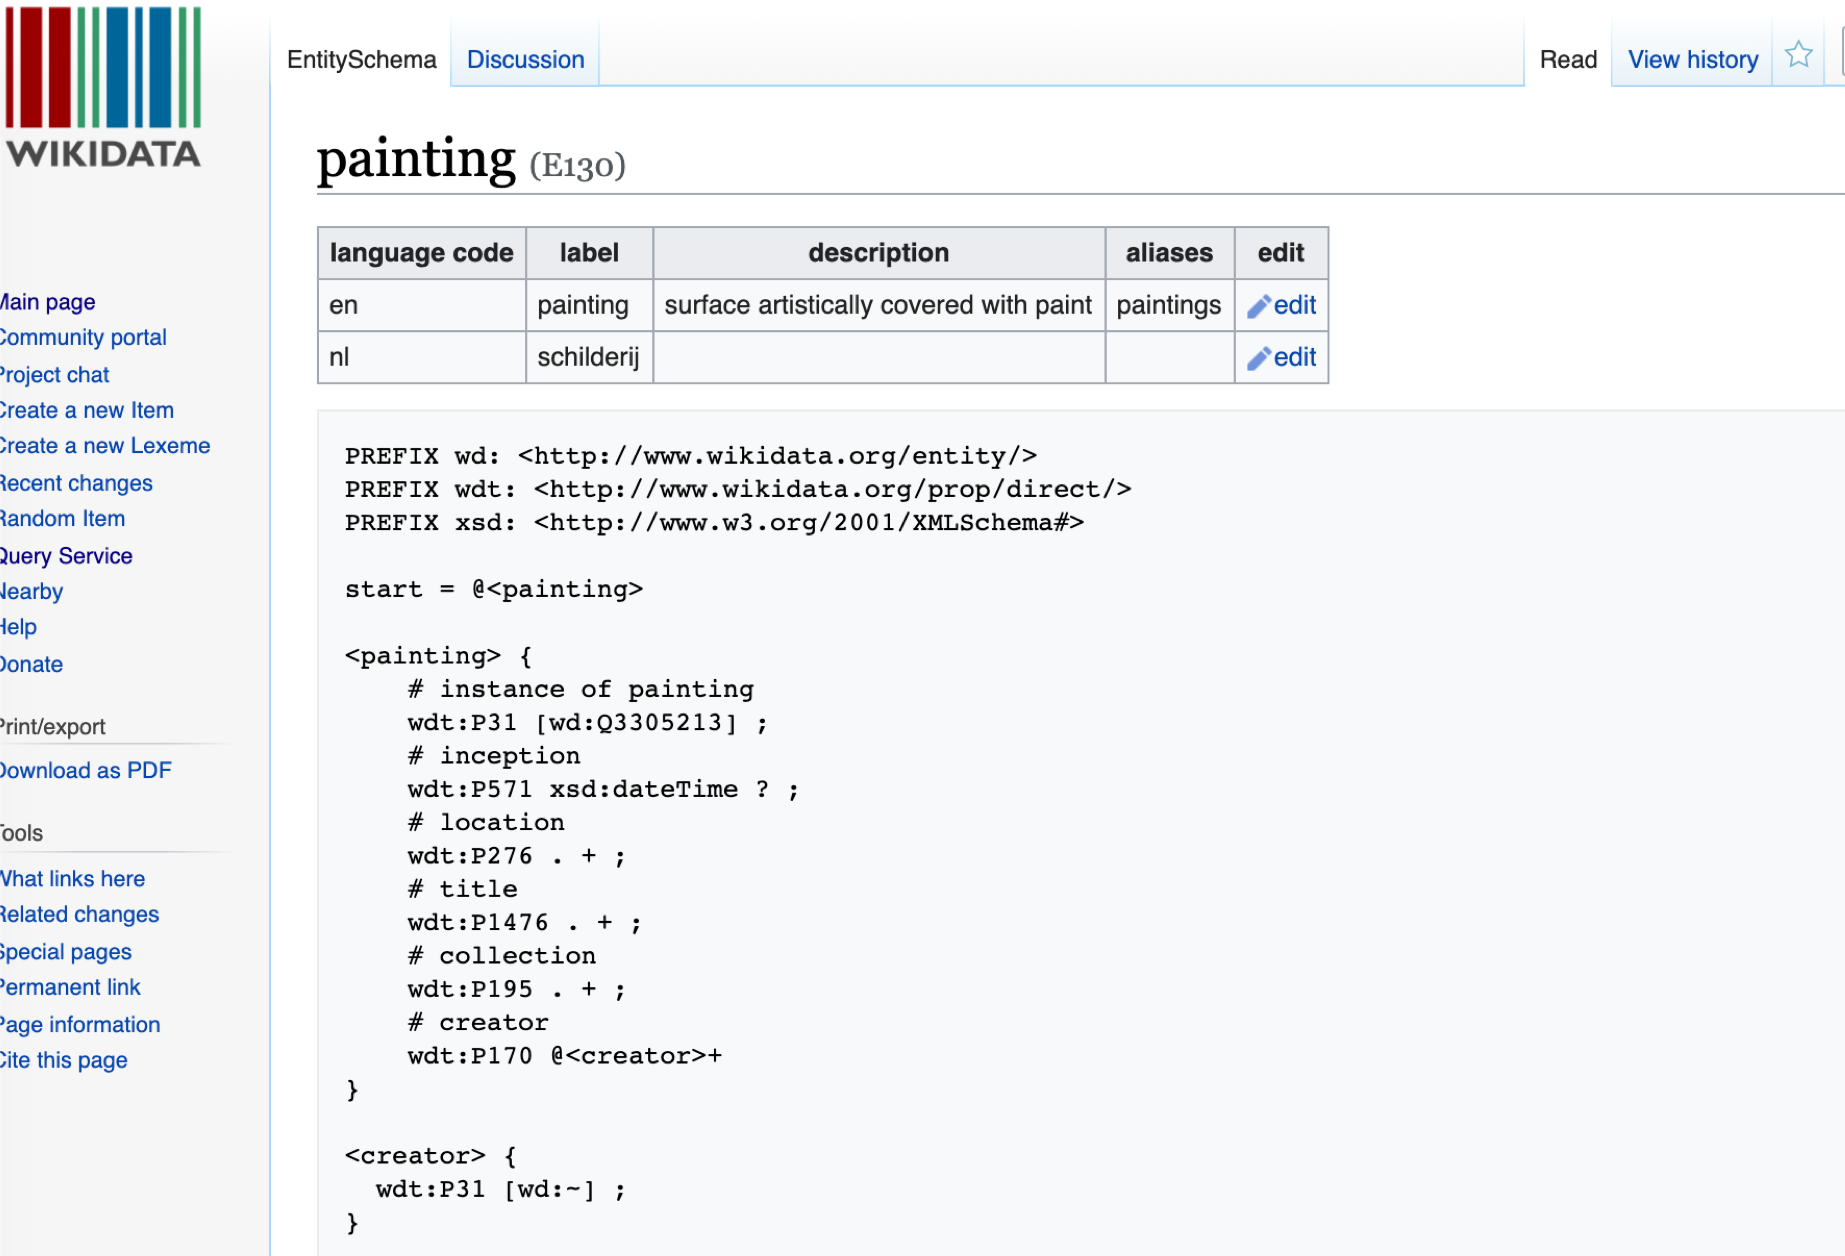
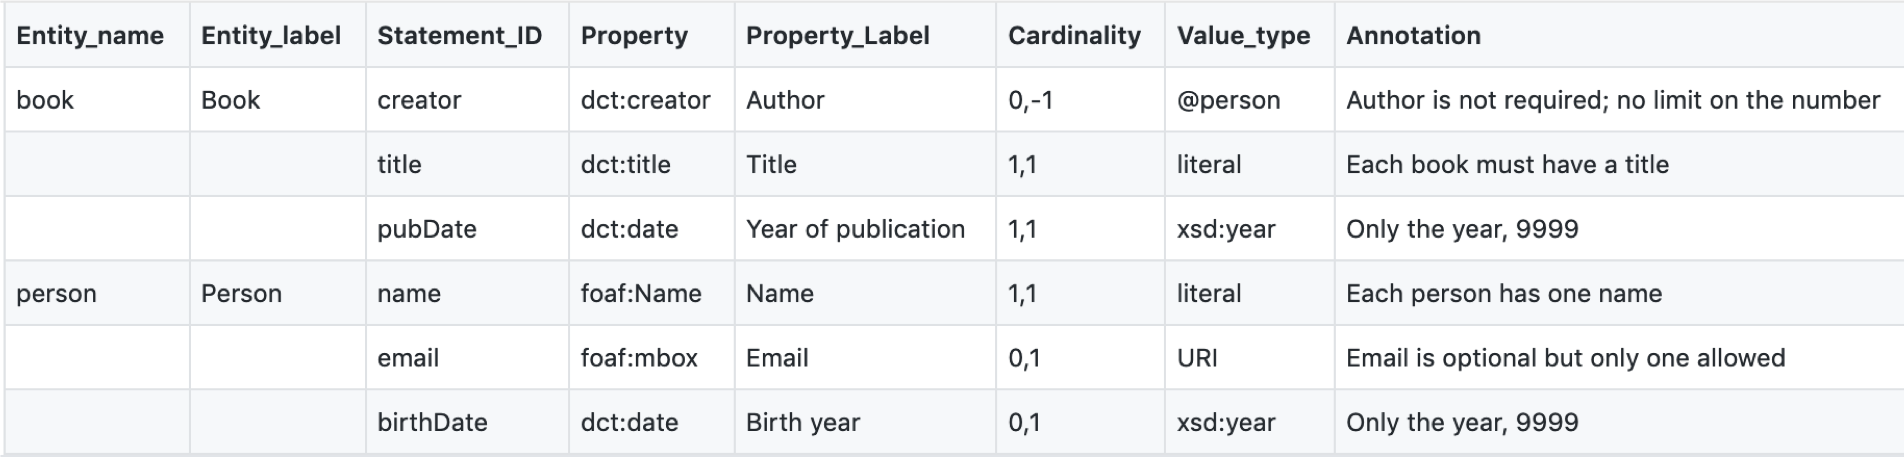
The elements of the Wikidata schema, along with the cardinality and value rules, can be defined in the following AP-STM table:
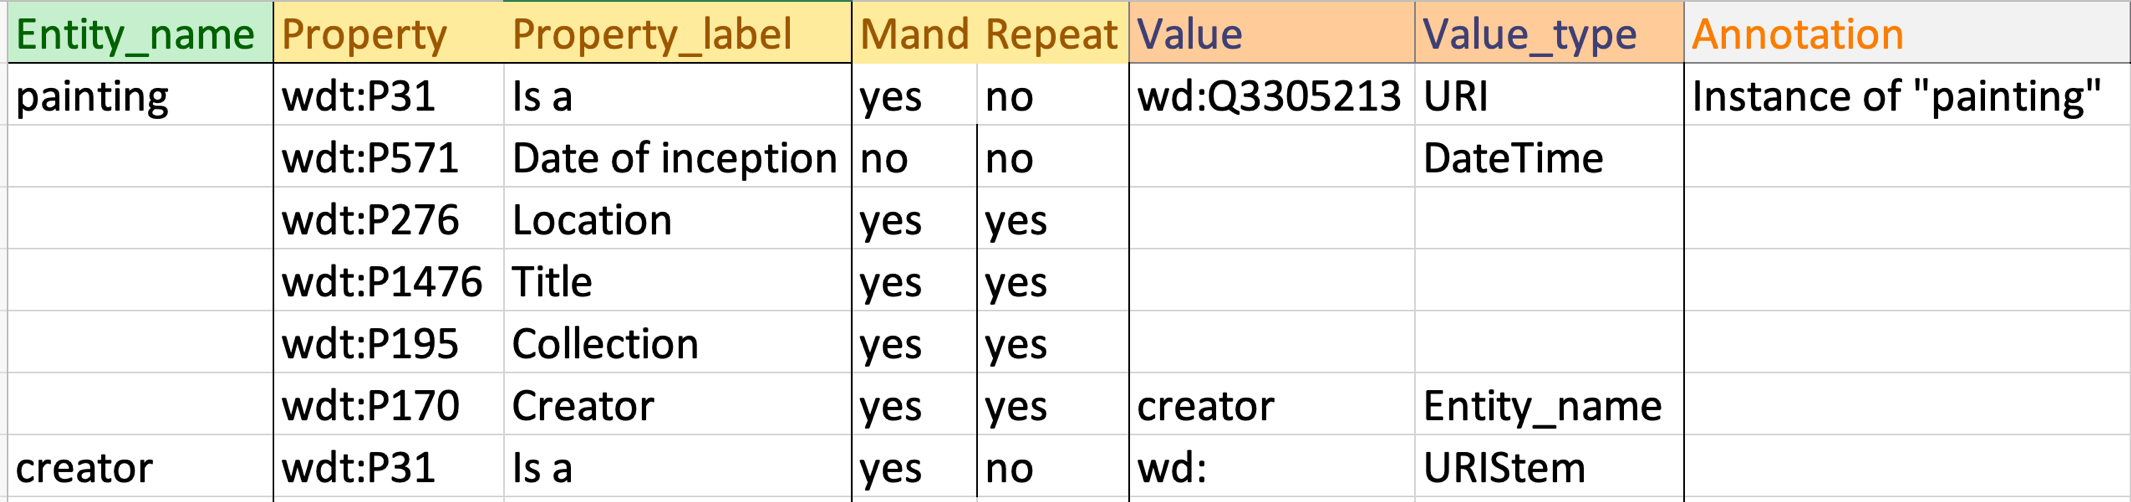
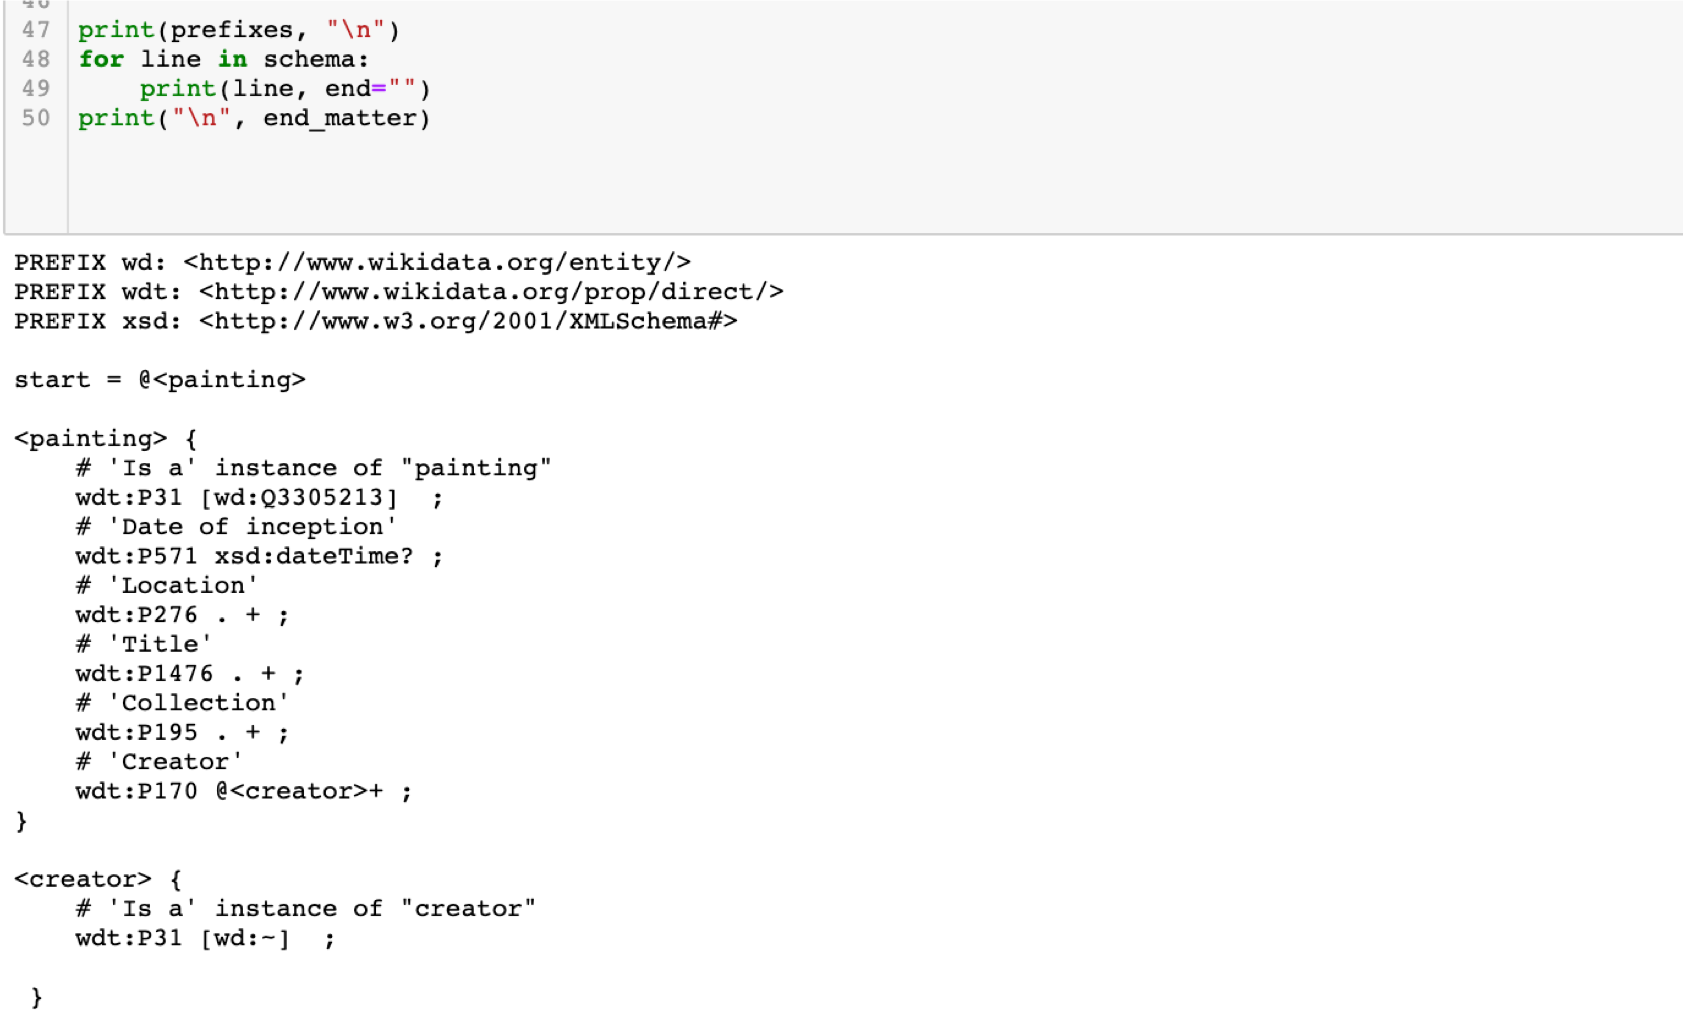
This tabular profile can be transformed by a Python script into a Wikidata ShEx schema:
Beyond developing the Simple Tabular Model itself, the DCAP Interest Group aims at providing a set of example AP-STM instances with matching instance data and conversion scripts for generating validation schemas in XML Schema, SHACL, or ShEx. In the ShExStatements project, John Samuel has improved on the code for converting AP-STM tables into ShEx schemas for validating Wikidata items. As of April 2020, clarification of the tabular model is proceeding in parallel with the development of actionable code.
From raw data to rich(er) data: lessons learned while aggregating metadata
Julia Beck, Frankfurt University Library
Introduction
The Specialised Information Service Performing Arts (SIS PA) is part of a funding programme by the German Research Foundation that enables libraries to develop tailor-made services for individual disciplines in order to provide researchers direct access to relevant materials and resources from their field. For the field of performing arts, the SIS PA is aggregating metadata about theater and dance resources from currently, mostly, German-speaking cultural heritage institutions in a VuFind-based search portal.
In this article, we focus on metadata quality and its impact on the aggregation workflow by describing the different, possibly data provider-specific, process stages of improving data quality in order to achieve a searchable, interlinked knowledge base. We also describe lessons learned and limitations of the process.
Challenges in Aggregation
The metadata that is aggregated in the SIS PA origins in different branches, i.e. libraries, archives and museums, different types of performing arts such as theater, dance, puppetry or performance art and overlaps with other disciplines like filmmaking and music. Due to this variety, in which different standardizations and archiving workflows are preferred, the gathered metadata tends to be very heterogeneous in data format, metadata standard, data model and vocabulary.
Additionally, differences in scope and detail of description as well as the handling of entities yields further challenges for the aggregation process. Especially the description of performances as some data is described object-centric while other collections focus on the description of events. In order to give the user a preferably consistent search experience, it is important to normalize this heterogeneity and make the collections linked and searchable on common entities and terms.
Workflow
Starting from the originally delivered metadata, the current workflow to achieve aggregated linked data that researchers can access in the discovery system consists basically of four stages: (1) thorough analysis and documentation of the delivered data, (2) preprocessing of the original data, (3) modeling and transforming the preprocessed title and authority data to EDM for more interoperability, (4) postprocessing, interlinking and enrichment of the entities.
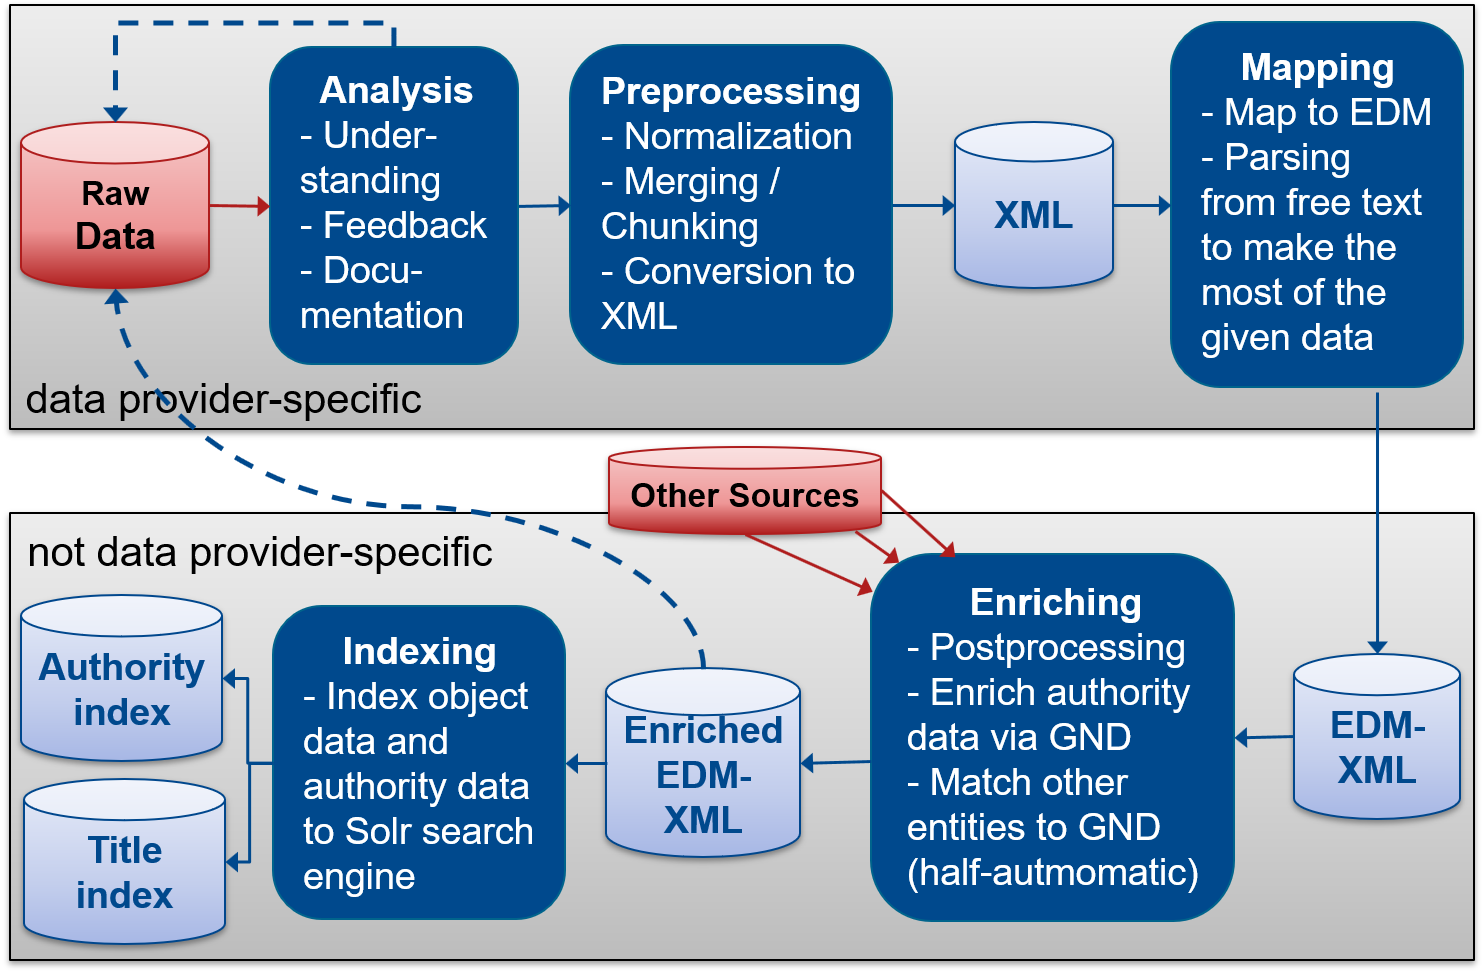
1 – Data Analysis
The first stage involves thorough analysis of the delivered metadata in cooperation with the data providers to understand the data structure and given information. This step is key in improving the search experience for users because it determines where what kind of information is found in the collection. The metadata is validated to find possible problems like invalid data and duplicate or missing identifiers that need to be handled in-house. A short analysis report for the data provider is written that documents statistics and facts about the data. It further contains a first draft on how the data could be mapped into the SIS PA data model regarding the content of the data fields.
The analysis reports can also be used to find common structures and vocabularies in the data and generate best practice guidelines about performing arts related metadata. This knowledge is shared among others with the study group ARCHIV of the Society for Theatre Studies in Germany. In addition, we are following the activities in other projects on performing arts data like WikiProject Performing arts.
2 – Preprocessing
In the second stage, where most steps are data provider specific, the metadata is preprocessed which means that it is prepared to be mapped into the internal SIS PA data model which is based on the Europeana Data Model (EDM). Since most of the data is delivered in XML serialization and XSLT mappings from the Europeana community transforming XML files to EDM can be reused, all data that is not delivered in XML is converted to XML in this step.
Huge data files are split into smaller, more manageable batches while one-record-files are merged to larger batches. Depending on the original data quality and standardization, special characters like non-sort characters are normalized and certain free text data fields are parsed to make their content available for the search. Normalization is also needed if the content is not strictly following the rules of a certain metadata standard.
3 – Mapping
After normalization, the data is mapped into an extended version of EDM. Deeper insights into the extensions of the data model to make it meet the needs of performing arts can be found here. Besides reusing existing mappings from the community, several new mappings to EDM were written for individual data models following the findings of the analysis report. This transformation maps the original data fields into the corresponding EDM classes and properties on a very basic level. Further enrichment will be done in the next stage in order to be able to do as many enrichment and normalization steps as possible in the same way for all data providers.
Hierarchies and other relations between records are preserved or generated if possible. If a data provider delivers their own authority data that is not already linked to e.g. GND or VIAF, this data is mapped to EDM contextual classes like edm:Agent or edm:Event as well.
4 – Enrichment
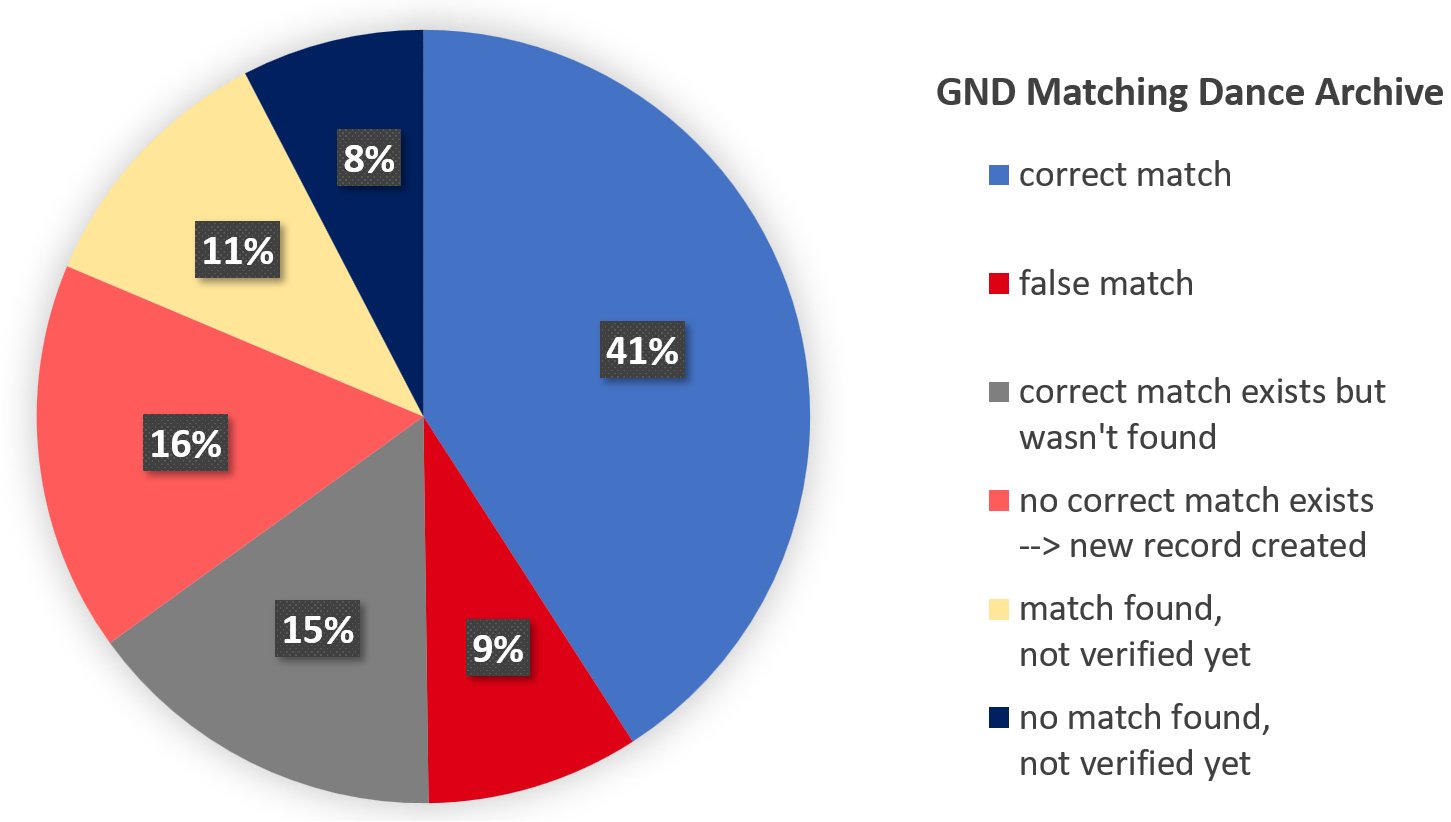
In the fourth workflow stage, which is enriching, all data is gathered in an XML database and is normalized once more. Date values are mapped to UTC standard, while language values are mapped to ISO standard. The data is validated in terms of missing mandatory fields, collection hierarchy errors, plausibility checks for dates and other problems that might have occurred during the mapping. After the title records are normalized and validation errors corrected, authority records from data providers and authority identifiers used in the title data are gathered and stored in a separate authority database. This authority data is matched to the GND as it is widely applied in the German speaking community and some of the data providers make use of it already. By means of the lobid-gnd service that is integrated into Open Refine’s reconciliation tool, authority records from data providers are matched to the GND and a project team member checks manually if the match was correctly made (s. Figure 3 as example for matching results). As authority records that do not exists in the GND yet are added during the project, the GND is gradually complemented with more agents and events from the performing arts domain.
For all GND identifiers used in the data, the GND entity dump from the German National Library is loaded to enrich the authority data. For example, alternative labels in the authority index help to improve search results and occupations that are based on a common vocabulary enhance faceting. In case the data contains GND identifiers that are no longer valid, these are replaced by the associated new GND and the GND type is corrected if it is not corresponding to the contextual class. After enrichment is done, the performing arts knowledge base can be used for various purposes. In the SIS PA, the title and authority data are indexed each into one search index core and are accessible through the project’s discovery system.
In order to achieve metadata roundtripping, the results of the analysis and enrichment are given back to the data provider in form of simple .csv files. The files contain, if applicable, corrections and normalizations like the standardization of date and language values as well as concordance lists of local authority identifiers and GND identifiers. This process offers the possibility to enrich the original database of a data provider. Though, as many data providers do not have the capacity or technical support to automate the import of metadata, the modified data is often ingested manually if time allows which simultaneously allows for verification.
Lessons Learned
Thorough analysis of the delivered metadata in close cooperation with the data providers in order to make the data as useful and findable as possible is key in upgrading the search experience for users. By working together and exchanging results, the data quality can be improved both for the data provider and the aggregator.
Since the matching task from literals to entities is hard to automate retrospectively and prone to error, we noticed it is important to make data providers aware of this problem so that the in-house data preferably already contains authority data. We did not attempt to match literals without further information to authority data yet as the automatic matching approach on in-house created authority data already lead to errors that had to be corrected manually.
We also learned that the use of database and pipeline tools can improve the workflow substantially. XML databases like BaseX that are made for the task of managing huge amounts of XML can reduce the process time immensely while pipeline tools like Luigi can help to keep track of all the small steps of the process.
Empirical evaluation of library catalogues
Péter Király, Gesellschaft für wissenschaftliche Datenverarbeitung mbH, Göttingen
How should a book be described properly? This question has a long past (and an even longer future) with several proposed methods which evolved over time. In the current epoch in the history of cataloguing or in other words bibliographic control we see the end of a period, and the start of a new one. In the past decades practitioners and researchers called attention to different drawbacks of MAchine Readable Cataloging, shortly MARC (see famous witty phrases such as “MARC must die”, or “Stockholm syndrome of MARC”), and there is an intensive research on the next generation of the proper bibliographic metadata schema and format, but MARC is not only still with us, it also makes the overwhelming majority of catalogue records.
When in the 1960-s Henriette Avram and her colleagues invented MARC the available information storage space was much less than it is nowadays, so the information should be compressed, therefore one of the main technical features of MARC is that wherever a piece of information could be described by an element of a closed list of terms this path has been chosen. The record contains abbreviated forms, while the standard describes the abbreviated terms in detail. It makes the human understanding of MARC difficult in its native form, but makes the machine readability and thus validation easy. Theoretically at least. The problem is that during the decades while the basic structure of MARC remained the same, MARC continued to grown into a giant standard, with a number of such small or big dictionaries (which sometimes are externally developed and maintained by other organizations, such as the content classification schemes).
The purpose of the current research is to estimate the quality of the records by measuring structural features, and find those records which could be improved. With the statistical analysis librarians and those who would like to work with or understand data for different purposes can get an overview of the catalogue. This overview might be helpful as well in the transition to the new bibliographic format. Knowing the data is necessary every time, independent of the format. The research is manifested as an open source software called Metadata quality assessment tool for MARC records. The tool's source code is available in the following repositories: https://github.com/pkiraly/metadata-qa-marc (backend with a detailed user guide), https://github.com/pkiraly/metadata-qa-marc-web (web based user interface). A demo site with the catalogues of Universiteitsbibliotheek Gent (Belgium) is available at http://134.76.163.21/gent/.
I think the ideal form of metadata assurance workflow follows a particular cycle (of which the the tool covers steps 2-4):
- ingest/transfer data from the catalogue to the measuring tool
- measuring individual records
- aggregation and statistical analysis of the record-level metrics
- reporting
- evaluation with domain experts
- improving the records within the catalogue (if necessary)
Compared with other open source MARC tools, the main characteristic of this one, is that it handles semantics of the data. The tool contains a Java model of the MARC21 standard, so it keeps track the following information about MARC data elements: name, URL of the definition, acceptable codes and their meaning, value constraints, indexing rules, corresponding FRBR functions, historical codes, applicable dictionaries, BIBFRAME name (if there are) and other rules. It is built in an extensible fashion, so the ruleset covers not only MARC21, but several MARC variations, such as the Deuthche Nationalbibliothek's MARC version, OCLC MARC (not fully implemented), and locally defined fields in different libraries (Gent, Szeged, Finnish National Library). When the tool reads a MARC record, it creates a triplet for each data element: location (field, subfield etc.), value, the definition of the data element. Thus way, it can validate all the data against its definition. Since the definition, or a machine readable format of MARC standard is not available elsewhere, the tool provides a way to export this data model export into a JSON scheme called Avram (named after the creator of MARC).
The tool runs a couple of measurements. Their results (stored into CSV files) are rendered by a lightweight web interface. The user interface is intended for the librarian, and it also contains a search interface for the catalogue, in order to connect the results of the analyses and the records.
Validation
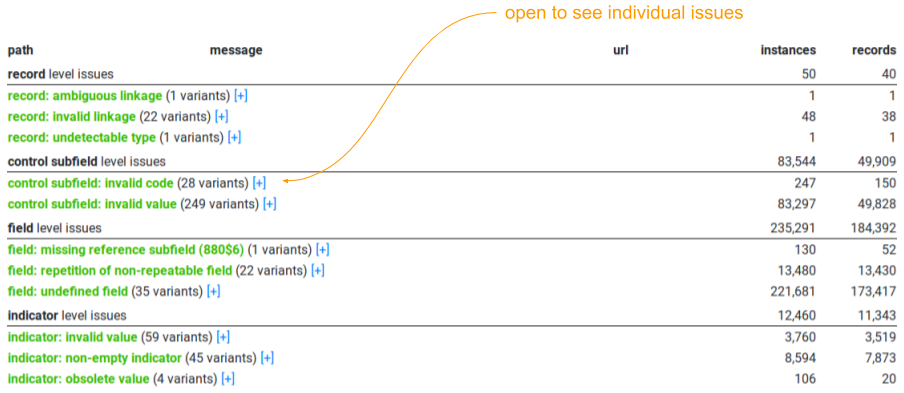
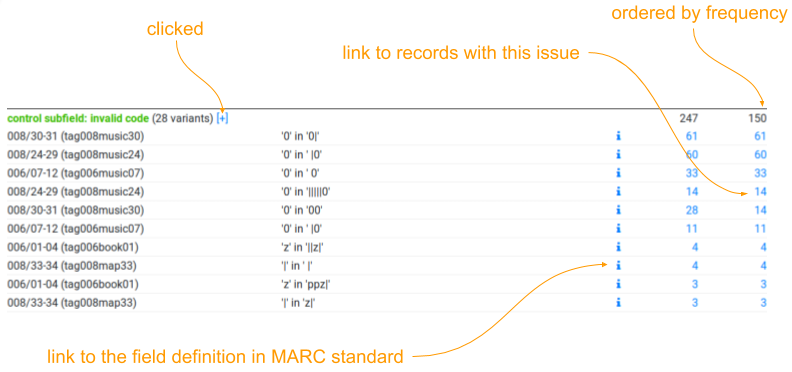
The validation analysis iterates all parts of the records and checks if the value fits the content rules, e.g. it has a proper abbreviation, the date encoding represents a real date, or the ISBN/ISSN numbers are valid. It groups the errors according to their location (record level, control field, subfield etc.). A common problem in almost every catalogue is that they use data elements which are locally defined but without publishing their documentation. In those cases, it is not possible to decide if the value of such an element follows the rules or not, thus the user interface provides two statistics: errors including these problems and “clear” errors. The result of validation of 16 different library catalogues was published in Király, 2019.
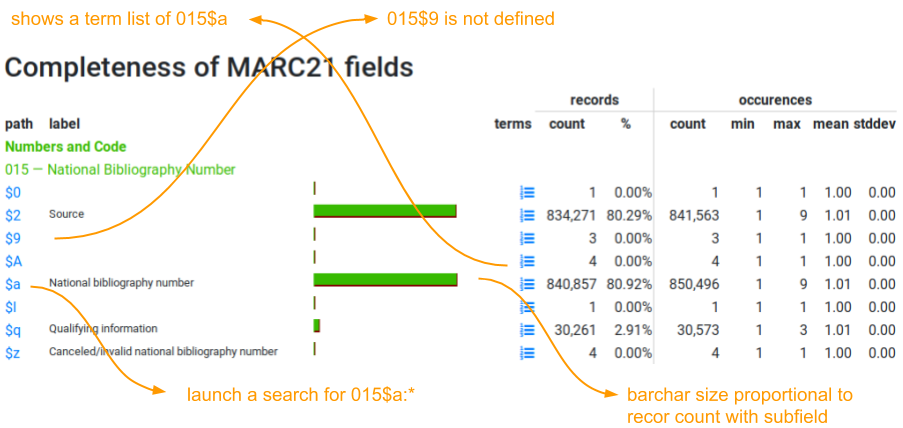
This analysis checks how field groups, fields and subfields are distributed in the collection. Field groups are the large categories under which the MARC standard lists individual fields, such as Numbers and Code (fields 01X-09X), or Edition, Imprint (25X-28X). The resulting tables show how many records contain a particular data element (both in count and percentage), shows the occurrences, its central tendencies (mean, standard deviation, minimum, maximum). The tool also shows the top terms within the data element, and the user can see which records contain that element.
Functional analysis
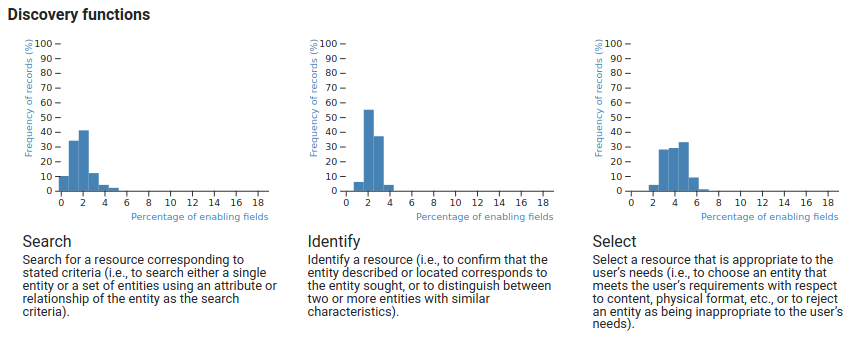
The FRBR defines 12 functions (such as search, identify, sort, display) which should be supported by bibliographic records. Delsey initialised a map between these functions and the individual data elements. The analysis at this stage checks how much portions of the data elements belong to a function are available in each record, then visualize the histograms of the support of functions. Since a usual record contains about 200 data elements, while the map handles more than 2000 elements which support functions (the MARC21 defines about 3000 elements), even the “richest” records can not support more than 10-15% of the functions, so the histograms display a relative support. It's intended use is to compare the support of individual functions, so the librarian can conclude that a catalogue has more data supporting selecting than searching.
Subject (classification) analysis
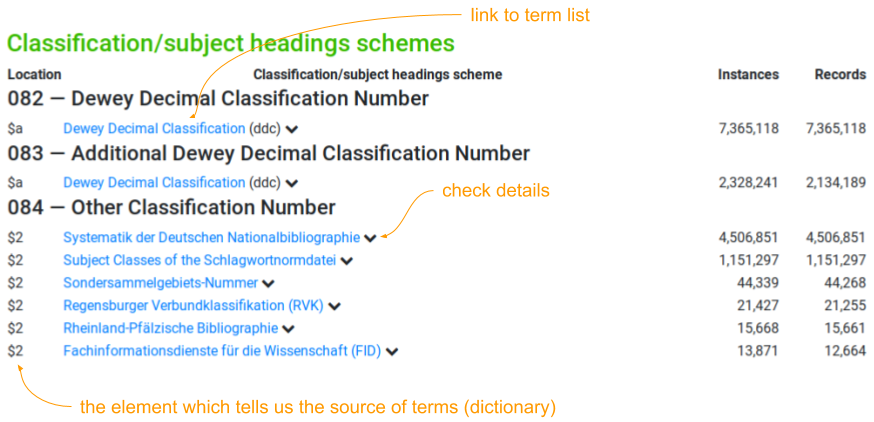
In MARC, there are fields to support different methods of content description. The analysis checks all these fields and explores how they are used: how many records have at least one content description, how many terms are attached to the record, what kinds of classification schemes or Knowledge Organisation Systems (KOS) are used, what are the additional fields alongside the term (such as the source of the term, the version of the KOS etc.) The user interface provides links to the list of individual terms within a KOS, where the terms' links trigger searches.
Authority name analysis
Authority names are more similar than subjects in terms of it provides normalized names for persons, meetings, corporates and even titles, which may or may not contain additional information, such as identifiers to vocabularies, dates and titles associated with the name, nature of contribution in the current record. This analysis follows the structure of the subject analysis.
Weighted completeness
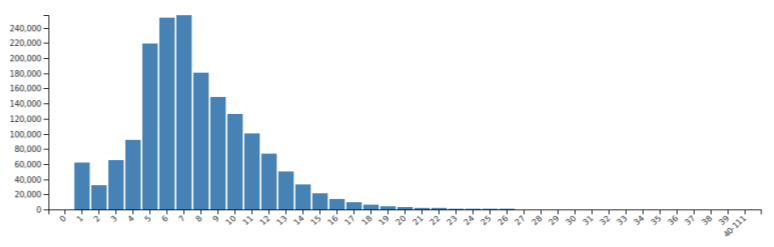
Completeness of MARC fields
The simple completeness takes the same importance for every field. In the literature, there are two suggested solutions to add weights of fields to emphasize importance. Thompson and Traill setup a scoring calculation for 19 data elements giving points by occurrences (in the range of 0 to theoretically unlimited). Their purpose was to select the best from MARC records vendors provided alongside ebooks. Carlstone followed a similar strategy but she was interested in MARC records of electronic serials (here a record might have negative numbers if it misses particular data elements). The tool implements both analyses, and provides visualizations for the score histograms (both for the total score and the individual factors).
Future plans
In the coming period, I would like to concentrate on the details of the KOS, particularly on two questions 1) if the record refers to a hierarchical KOS, whether it uses generic or specific terms (located close to or far away from the top-level terms of the hierarchy) 2) If we see the catalogue as a graph in which the records represent the nodes and subjects represents edges which connects records together, what are the nature of this network. Another development direction is to enhance the tool to cover other formats such as PICAplus and UNIMARC. I work together on these tasks with Verbundzentrale des GBV (Göttingen), ZBW – Leibniz-Informationszentrum Wirtschaft (Hamburg) and the Agence bibliographique de l'emseignement supérieur (Montpellier). I am looking for additional cooperation with libraries, so Dear Reader, if you are interested in this research, please contact me at pkiraly.github.io/contact/
Acknowledgments
Thanks to J. Rolschewski, Phú, J. Voß, C. Klee, P. Hochstenbach, D. Moreels, O. Suominen, T. Virolainen, Kokas K., Bernátsky L., S. Auer, B. Genat, Sh. Doljack, D. L. Rueda, Ph. E. Schreur, M. Lefferts, A. Jahnke, M. Kittelmann, J. Christoffersen, R. Heuvelmann, Gyuricza A., Balázs L., Ungváry R., G. Coen, A. Ledl, A. Kasprzik, U. Balakrishnan, Y. Y. Nicolas, M. Franke-Maier, G. Lauer who helped in different phases of this research.
References:
- Jakob Voß (2019) Avram Specification v0.4.0 (2019-05-09) https://format.gbv.de/schema/avram/specification
- Tom Delsey (2002) Functional analysis of the MARC 21 bibliographic and holdings formats. Tech. report, Library of Congress, 2002. Prepared for the Network Development and MARC Standards Office Library of Congress. Second Revision: September 17, 2003. https://www.loc.gov/marc/marc-functional-analysis/original_source/analysis.pdf.
- Kelly Thompson and Stacie Traill (2017) Implementation of the scoring algorithm described in Leveraging Python to improve ebook metadata selection, ingest, and management, Code4Lib Journal, Issue 38, 2017-10-18. http://journal.code4lib.org/articles/12828
- Jamie Carlstone (2017) Scoring the Quality of E-Serials MARC Records Using Java, Serials Review, 43:3-4, pp. 271-277, DOI: 10.1080/00987913.2017.1350525 URL: https://www.tandfonline.com/doi/full/10.1080/00987913.2017.1350525
- Péter Király (2019) Validating 126 million MARC records. In DATeCH2019 Proceedings of the 3rd International Conference on Digital Access to Textual Cultural Heritage pp. 161-168. DOI 10.1145/3322905.3322929