Issue 12: Pelagios
EuropeanaTech Insight is a multimedia publication about R&D developments by the EuropeanaTech Community.
EuropeanaTech Insight is a multimedia publication about R&D developments by the EuropeanaTech Community.
Since the beginning, EuropeanaTech has been a strong proponent of the value that Linked Open Data can bring to the digital cultural heritage sector. At EuropeanaTech 2011, Antoine Isaac presented data.europeana.eu, a prototype with an initial small number of Europeana data providers who were committed to providing more open data. From there, Europeana’s commitment to providing open and linked data, as well as using existing databases to enrich materials, has continued to grow.
Linked Open Data - What is it? from Europeana on Vimeo.
One of the greatest resources and communities for LOD and tools that can assist with presenting it that Europeana has had the pleasure of working with over the years is Pelagios. This issue of EuropeanaTech Insight is solely dedicated to the Pelagios community and was done in close collaboration with the Pelagios team.
Pelagios is a community and infrastructure for Linked Open Geodata in the Humanities. Their well known resources, Recogito, a tool that makes it easy to identify, record and export as Linked Open Data the places referred to in historical texts, maps and tables; Peripleo, a search service that allows you to find community-curated content related to specific places; and Pelagios Map Tiles, a set of resources that allow you to project data onto dynamic maps dedicated to different historical period are widely used by digital humanities researchers and heritage institutes.
EuropeanaTech has been engaged with Pelagios for many years. Europeana's R&D Manager, Antoine Isaac sits on the Sustainability Advisory Board and Pelagios' Technical Director, Rainer Simon, has worked on multiple EuropeanaTech projects including a Pilot for Time-and-Place Discovery during Europeana V2.0, a technology demonstration implemented on the basis of Peripleo, a prototype spatiotemporal search and visualization platform by Pelagios Commons. Europeana’s former search specialist Timothy Hill was also a very active member of Pelagios, co-coordinating the Linked Pasts Working Group. And of course, many members of the EuropeanaTech community are active contributing to our making use of Pelagios and its services.
This edition provides seven different implementations and insights into making use of Pelagios and being involved in the community. It’s a rich resources for any researcher or institute curious about exploring LOD or those already familiar with it curious about implementing it in new settings.
We hope it inspires new implementations of Pelagios!
Pelagios is now a formal association of equal and interdependent partners. If you would like to join, or if you just want to find out more, go to pelagios.org or follow @PelagiosNetwork on Twitter.
Thank you to Rebecca Kahn, Researcher, Alexander von Humboldt Institute for Internet and Society, and Pelagios Community Manager (data contributors) for all her work facilitating the creation of this edition of Insight.
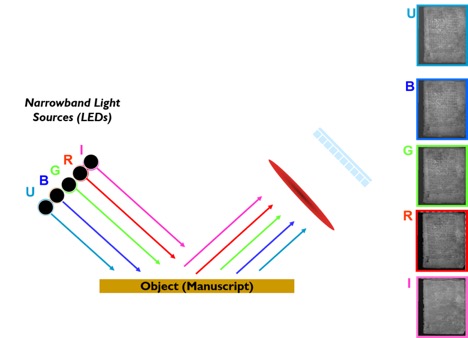
The Lazarus Project is a multispectral imaging collaboration, now based out of the University of Rochester. We employ state-of-the-art imaging technology to digitally recover faded, burned or otherwise damaged documents. Our multispectral camera system, designed by Ken Boydston at Megavision, consists of a 50 megapixel monochrome sensor, an apochromatic quartz lens, a dual filter wheel that separates fluorescent from reflected light, a multispectral transmissive light source that shines through the parchment, and a series of 16 highly specialized low-heat LED lights.
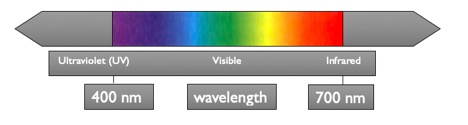
The manuscript or cultural heritage object under consideration is photographed under discrete wavelengths of light. Each of these wavelengths has the potential to reveal different aspects of the object: the longer infrared wavelengths penetrate most deeply into the substrate, revealing ink and pigments in areas that have been darkened, overwritten, or charred, while the shorter ultraviolet bands induce fluorescence that may render faint or faded text legible once more.
The captured images are then digitally ‘stacked’ and subjected to statistical processing using software that is primarily used for analyzing aerial and satellite imagery. This workflow enables the recovery of text and images which may be fully invisible due to damage, deliberate erasure, or simple age.
However, the large-scale interdisciplinary nature of many imaging projects poses unique challenges. Firstly, when we create an image of an object, we often collaborate with imaging scientists, image processors, and scholars around the world. Those processing the images need to effectively share their results, while the scholars tasked with deciphering the recovered texts must be able to communicate (for example) which portions of the object have been rendered legible and which are in need of further processing. We therefore require a single platform that enables individuals at multiple institutions to see and work on an image. Workarounds such as emailing individual images back and forth or sharing them via services like Google Drive or Dropbox have proven cumbersome and inefficient for the needs of our projects—a truly collaborative environment requires shared access. Secondly, as they begin to translate, transcribe, and generally study the recovered digital object, how might they annotate it? Due to the nature of our work, the text of many of the objects we recover have never before been transcribed. Many, too, have unusual shapes or layouts—e.g., maps, globes, cave paintings—which do not lend themselves well to typical word processors or to other annotation software. We are thus in need of a way to make notes directly on the recovered digital objects.
Pelagios, and particularly their Recogito site, solves both of these problems for Lazarus. There, images can be can be hosted, shared, and annotated: scholars can identify areas of the object which may need further processing, image processors can share techniques and strategies that have proven useful (or not), and transcriptions can be made directly on the images themselves.
Furthermore, Recogito’s privacy control settings are invaluable for collaborative recovery projects. Many of these involve proprietary or sensitive objects, and are sometimes carried out under non-disclosure agreements. Pelagios allows users to upload an image which can then be viewed either solely by the uploader or by a select group of other users who have been granted access. This enables the creation of separate working groups within larger projects, wherein each user has access only to those images which pertain directly to his or her work. The utility and interactivity of Pelagios created an ideal platform for our multispectral imaging team to use when collaborating with scholars, museums and imaging scientists around the world.
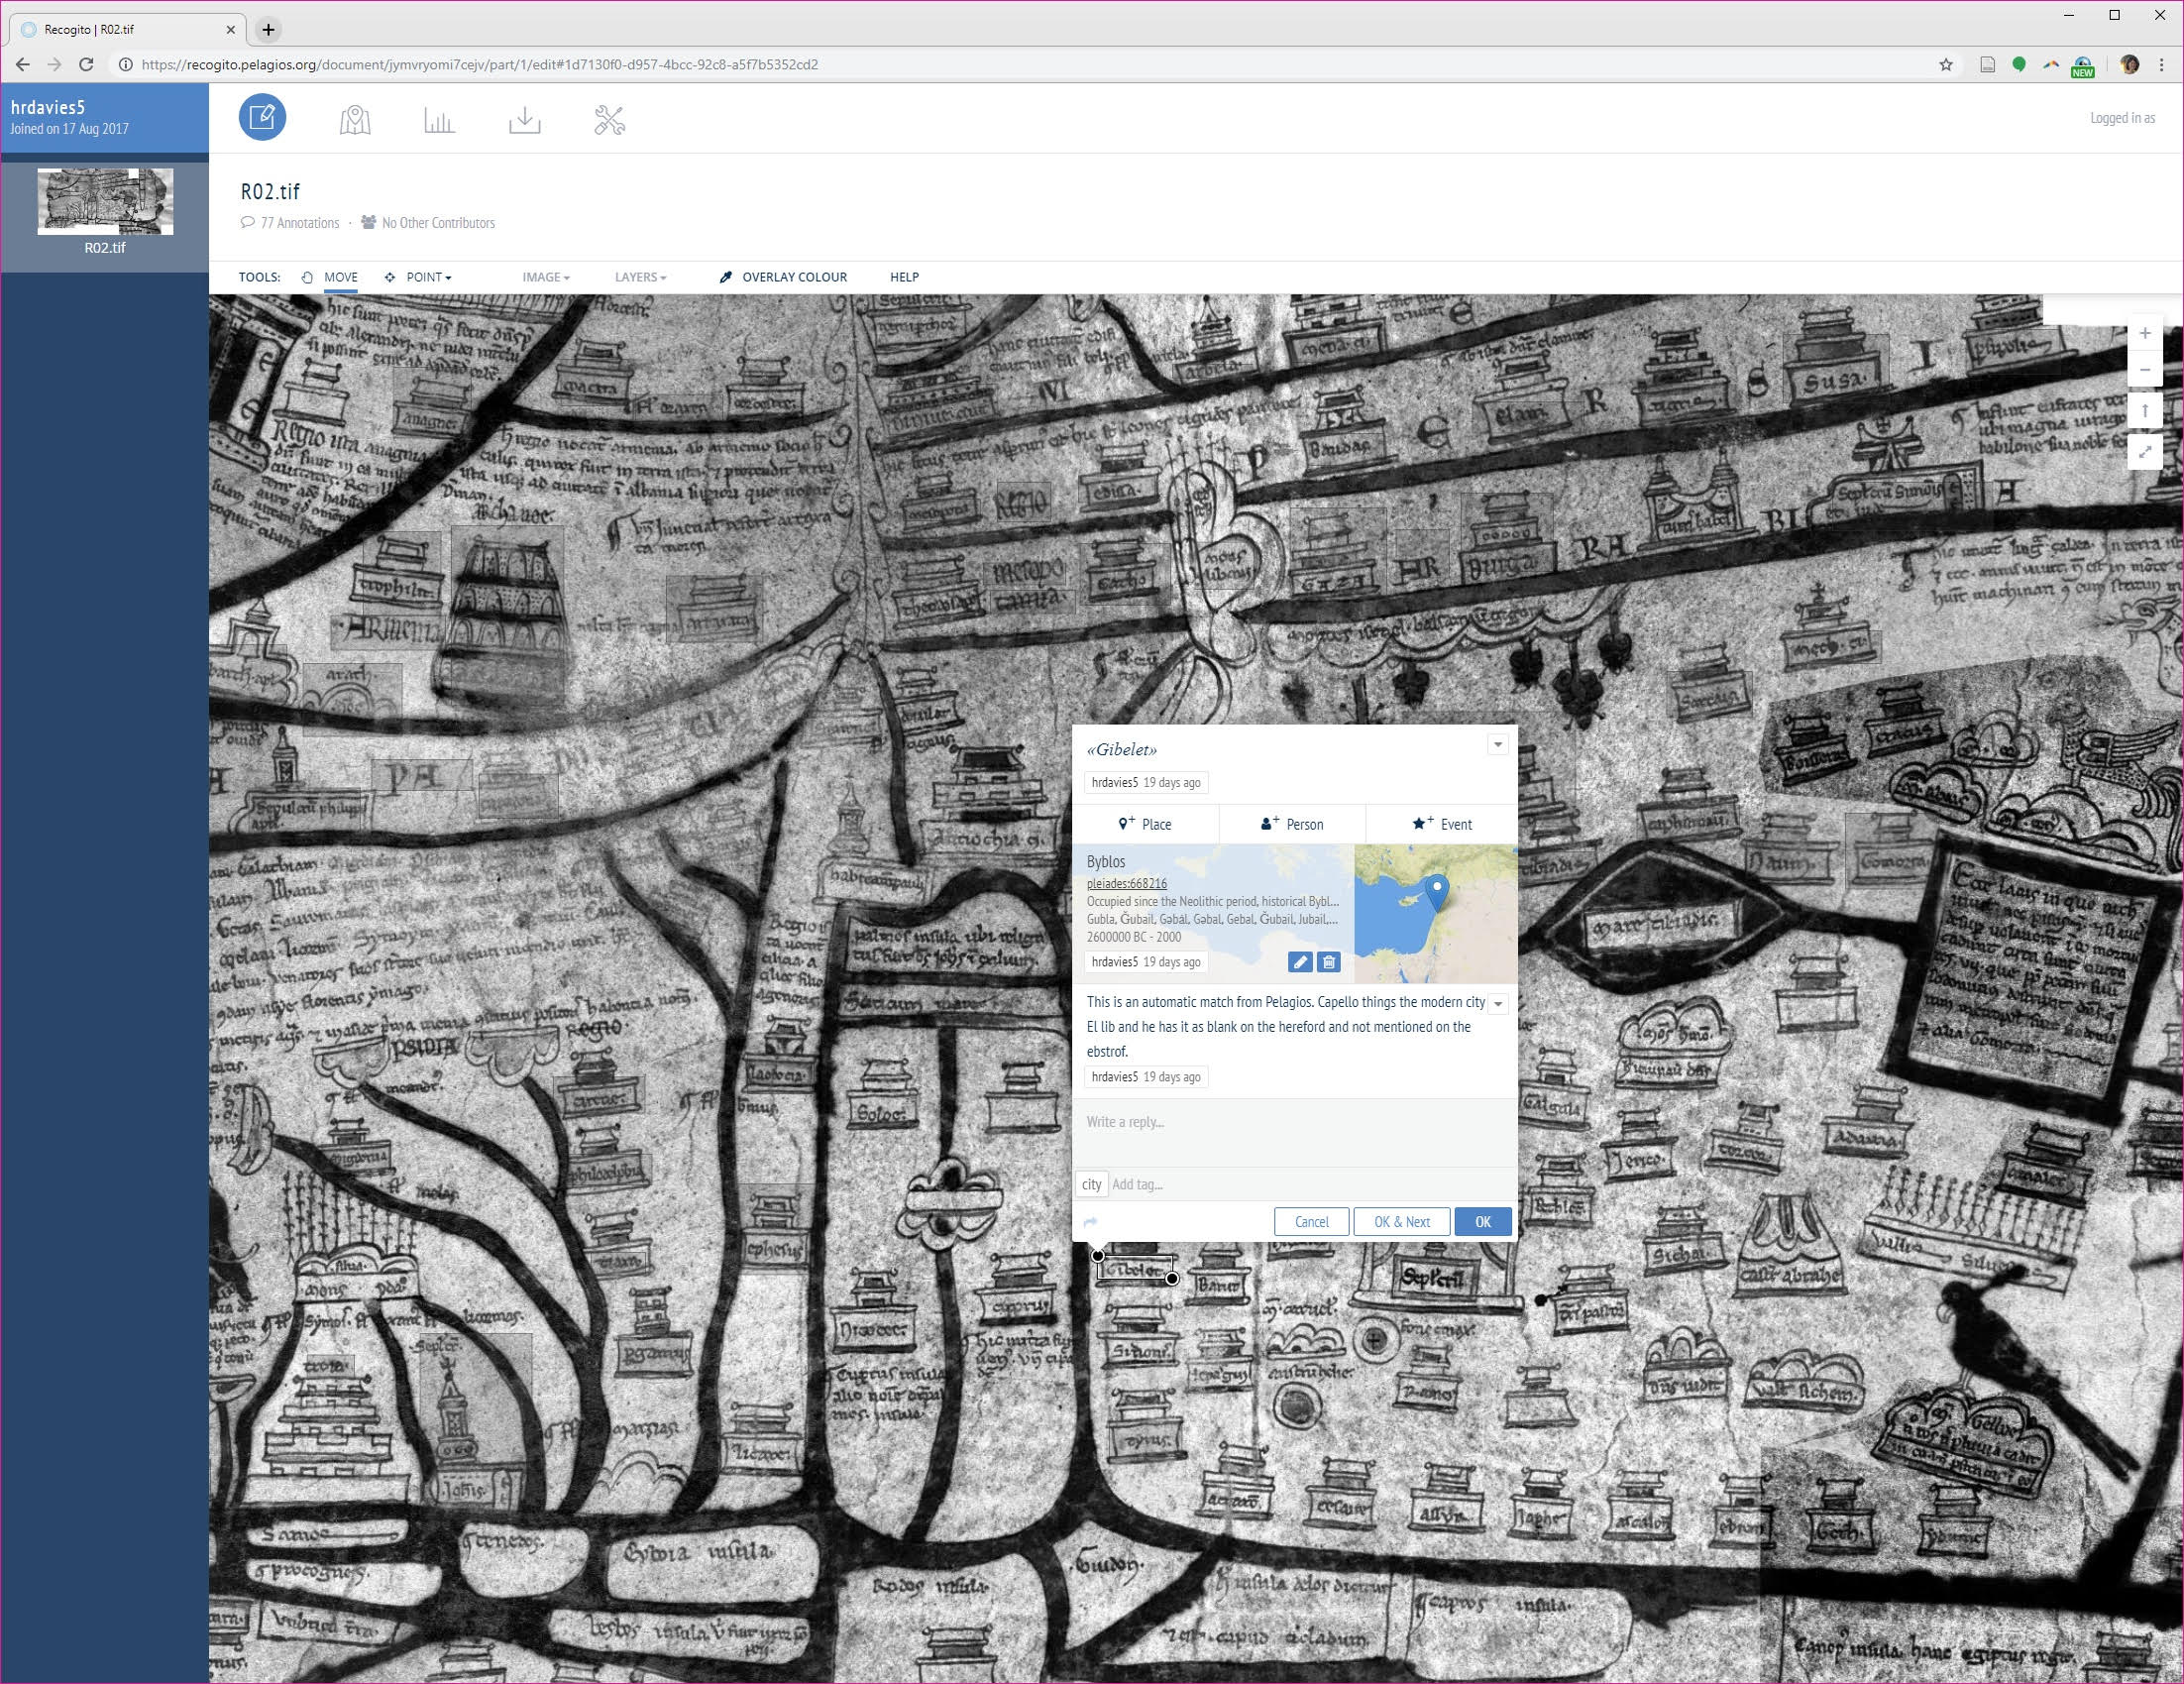
We noted above scholars’ need to transcribe, translate and annotate the newly-recovered project, and the particular difficulties posed by objects with unconventional shapes or layouts. In the summers of 2013 and 2014, the Lazarus Project travelled to the Biblioteca Capitolare in Vercelli, Italy to image (among other items) the Vercelli Mappa Mundi. Helen Davies, a Lazarus Project graduate student and co-author of the present article, has since processed these images and recovered nearly the entire thirteenth-century mappa mundi. Transcription of this object had been attempted only once before, by Carlo Capello in 1975 [1]. By that date, however, the map had already suffered significant damage, leaving a void in the transcriptions waiting to be filled by multispectral imaging.
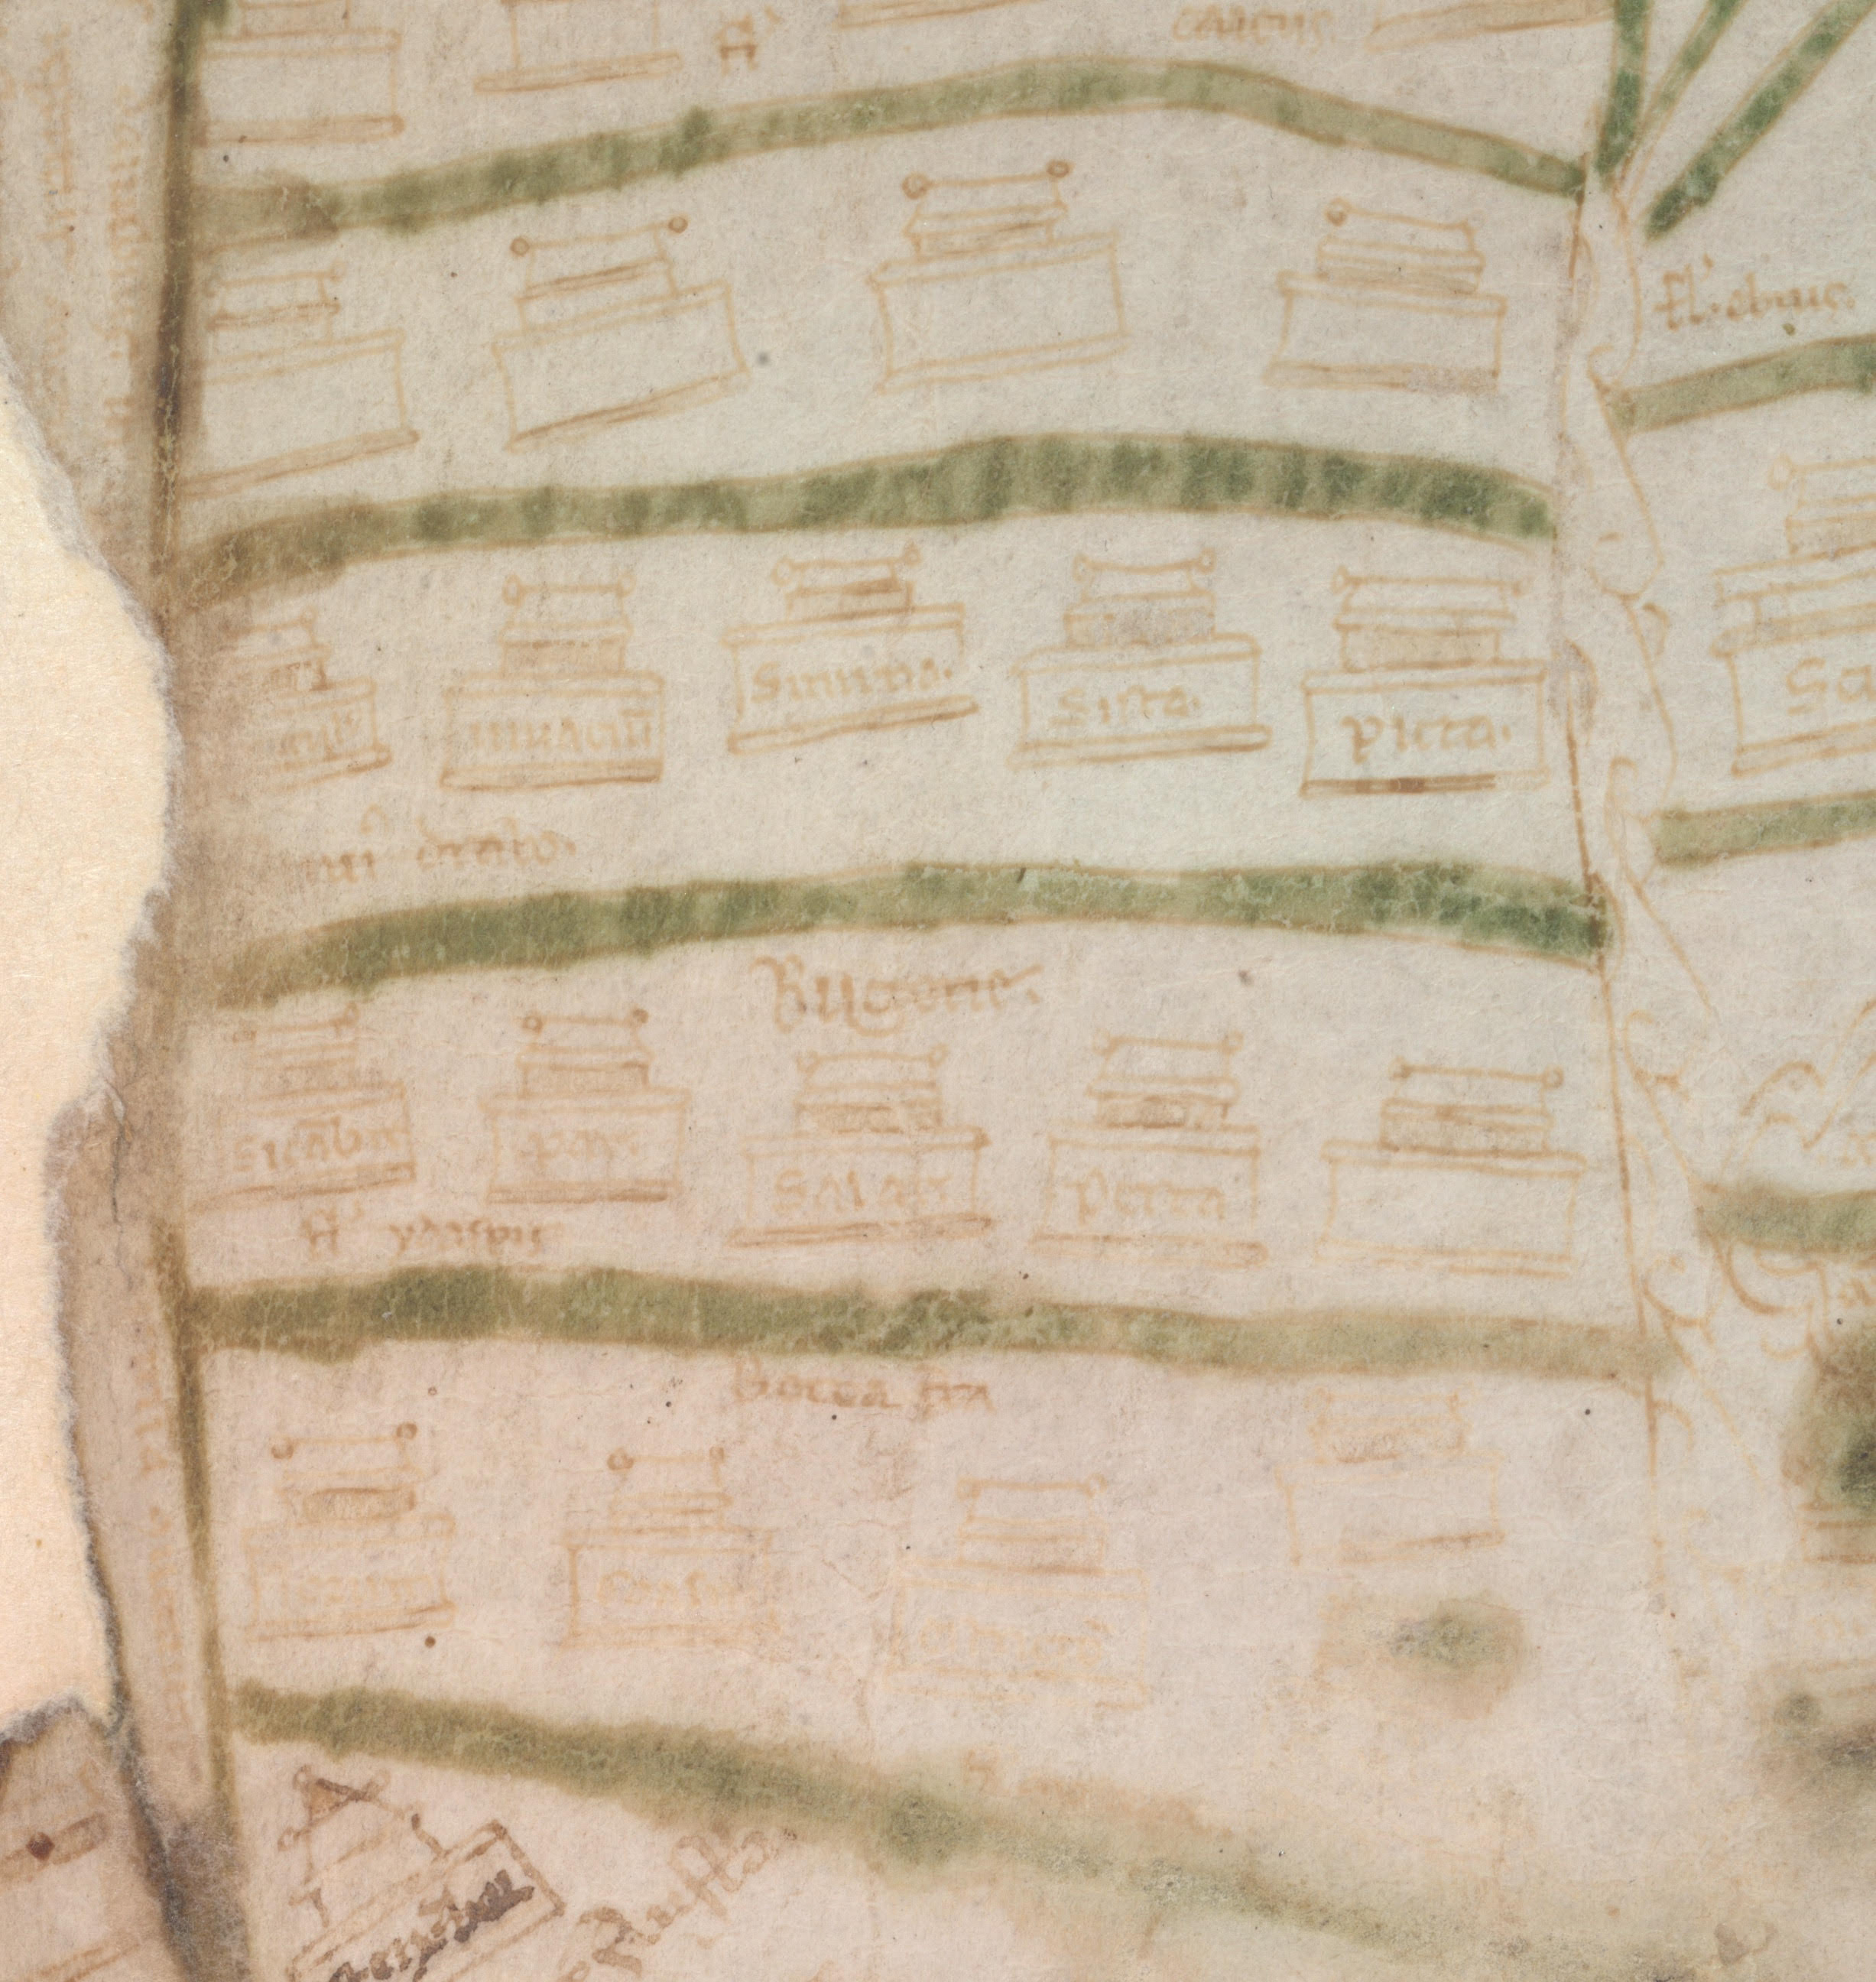
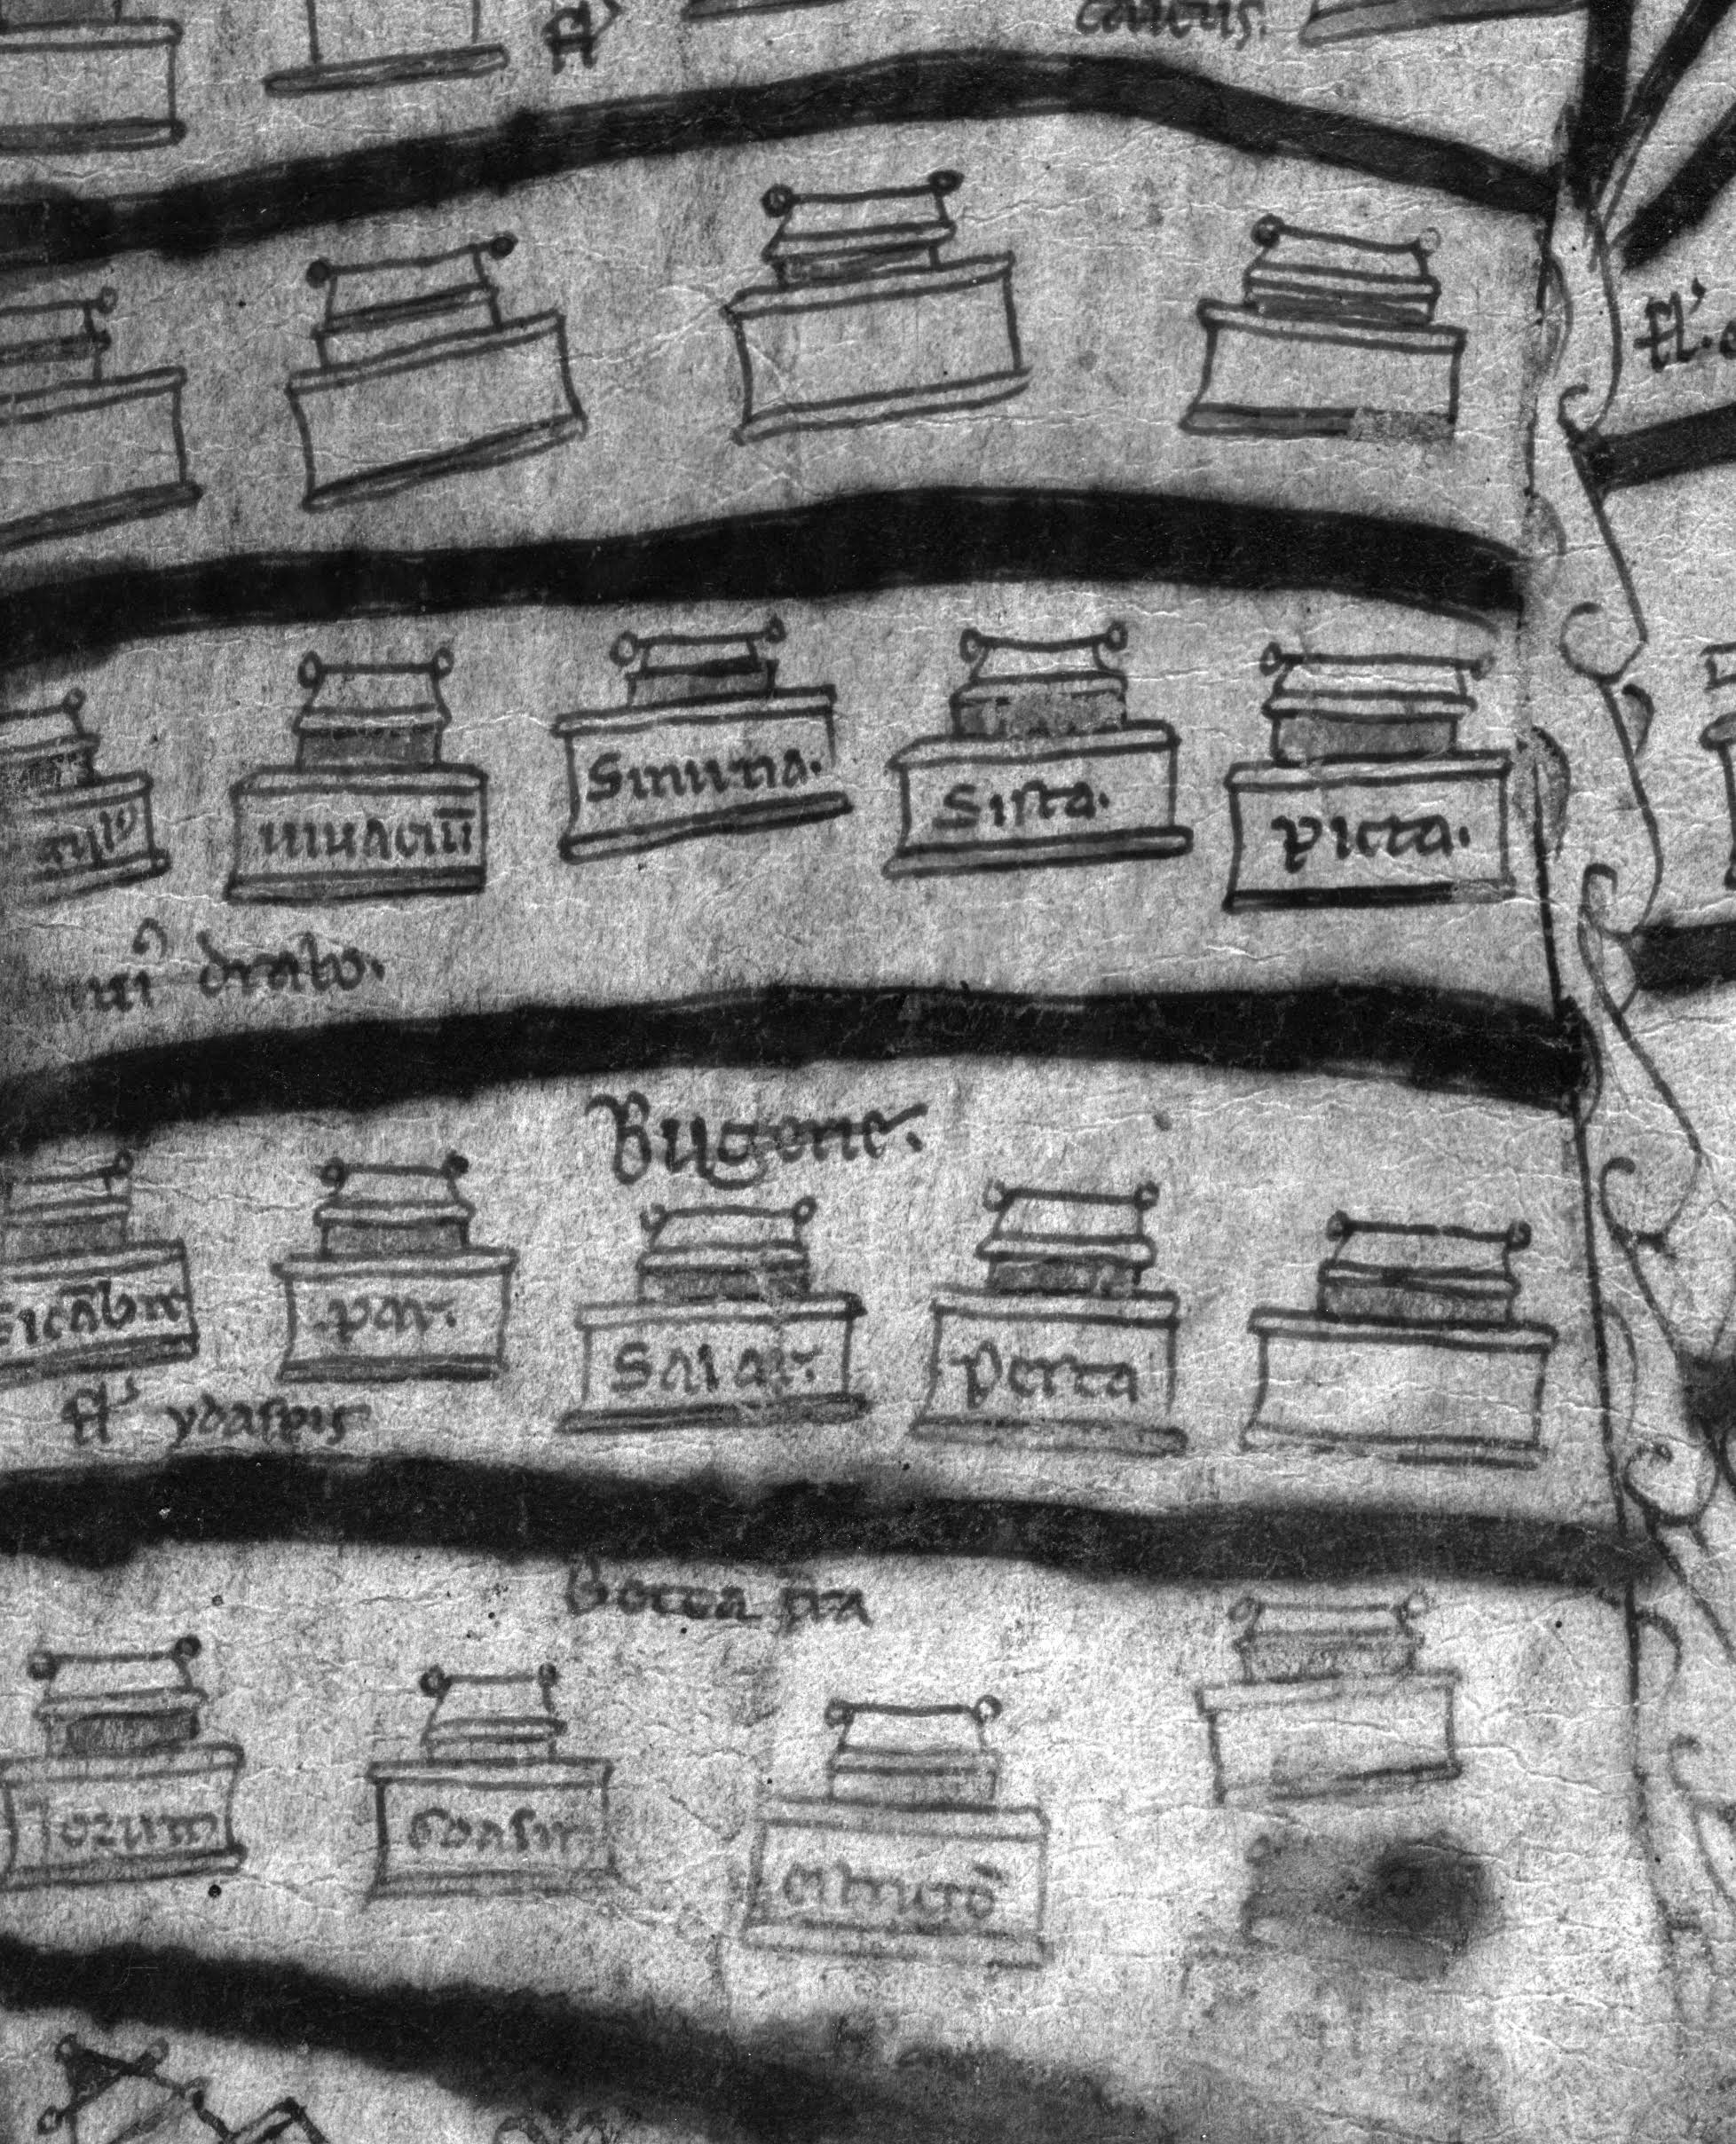
As part of her PhD dissertation, Davies must now transcribe and translate all of the recovered inscriptions on the map. The aim will be to compare each of her transcriptions to Capello’s. In the form of Recogito, Pelagios offers a tool with which to tie all of this information together and connect it directly to the object in question. The annotation capabilities of the platform allow Davies to transcribe a portion of the map and then fill in a note below which may include, e.g., Capello’s transcription, translations of the Latin text, and other relevant notes. Additionally, Recogito’s map functions allow the user to geolocate a historic place on the medieval map with the contemporary place on a digital, satellite map. Given the unusual geographic orientation of medieval maps, the author looks forward to viewing the final comparison between historic and contemporary understandings of place and spatial orientation.
As the above examples illuminate, Pelagios provides a platform which solves several central issues of both collaboration and annotation which digital humanists face when working with recovered images and digital surrogates of medieval manuscripts and other objects.
[1] Carlo F. Capello, Il Mappamondo Di Medioevale Di Vercelli, MEMORIE E STUDI GEOGRAFICI 10 (Torino: Stabilimento Tipografico C. Fanton & C., 1976
Gazetteers are becoming a prominent tool in the digital humanities. Providing stable identifiers (URIs) for places, they enable aggregation of data coming from different digital resources (such as archives and libraries). But they are also a research tool of their own, since they help us to define and analyse our geographical knowledge of both present and past, to uncover and take into account biases, and to interrogate ourselves on the nature of what we call “a place”.
Minting, and making available online, unique identifiers for places, gazetteers play a crucial role in the Linked Open Data panorama, by virtue of allowing disambiguation and facilitating analysis of spatial information. Therefore, it’s not surprising that the number of gazetteers, specific to a particular area or period of time grows daily. Gazetteers enable more effective annotation of digital documents, cataloguing of digital resources, and overall analysis of historical geographies. There is a gazetteer for the ancient world, one for historical China, one for medieval Islam, one just focusing on the island of Cyprus, and so on.
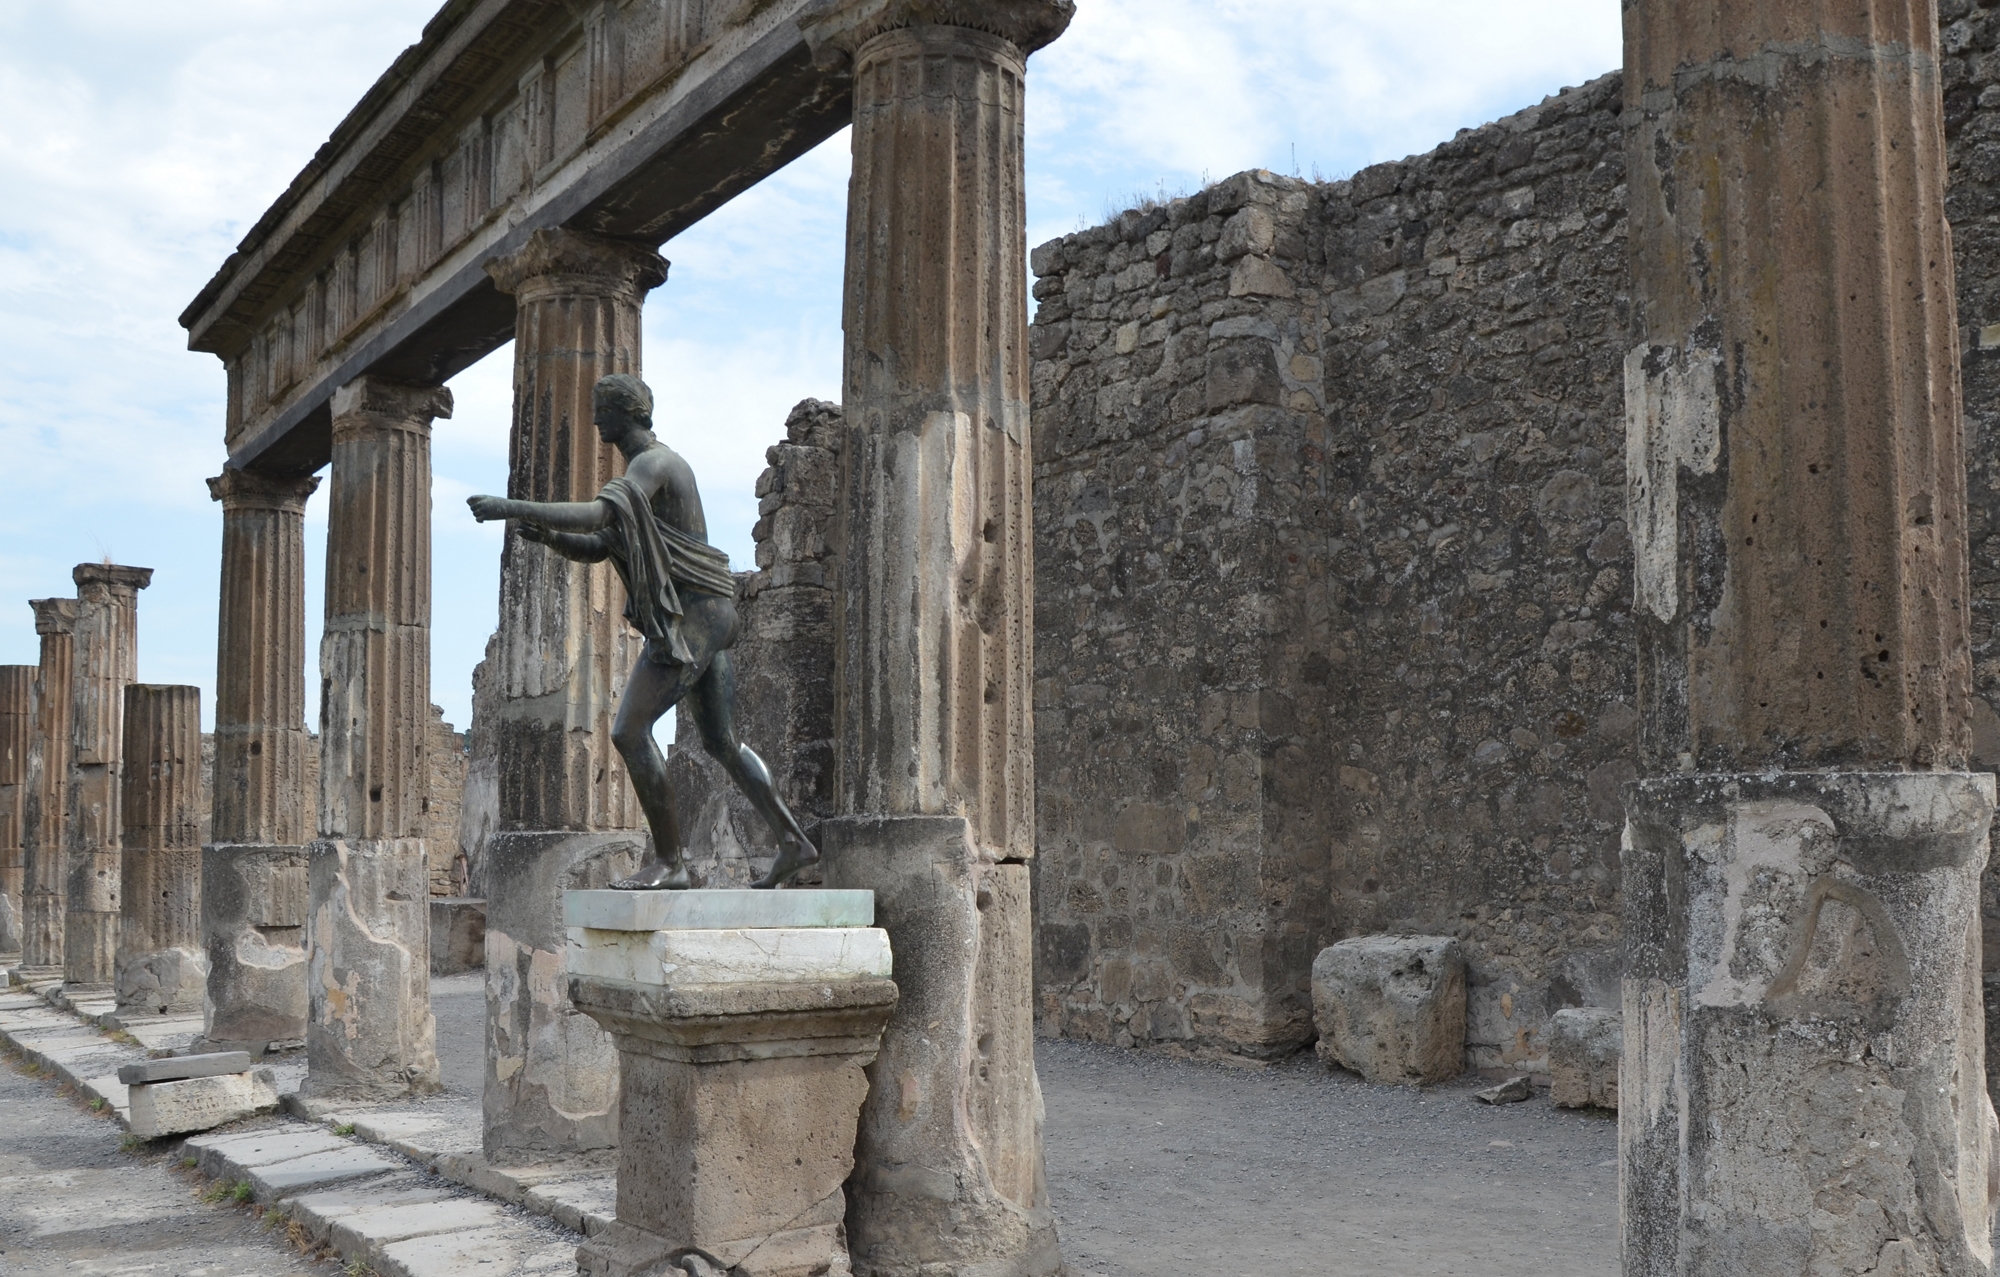
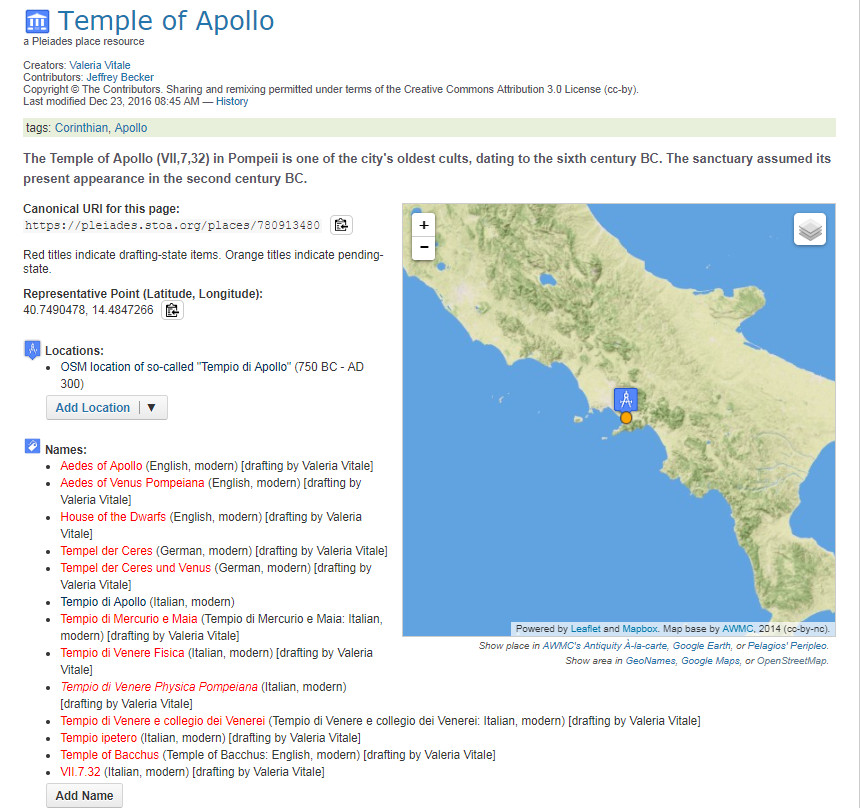
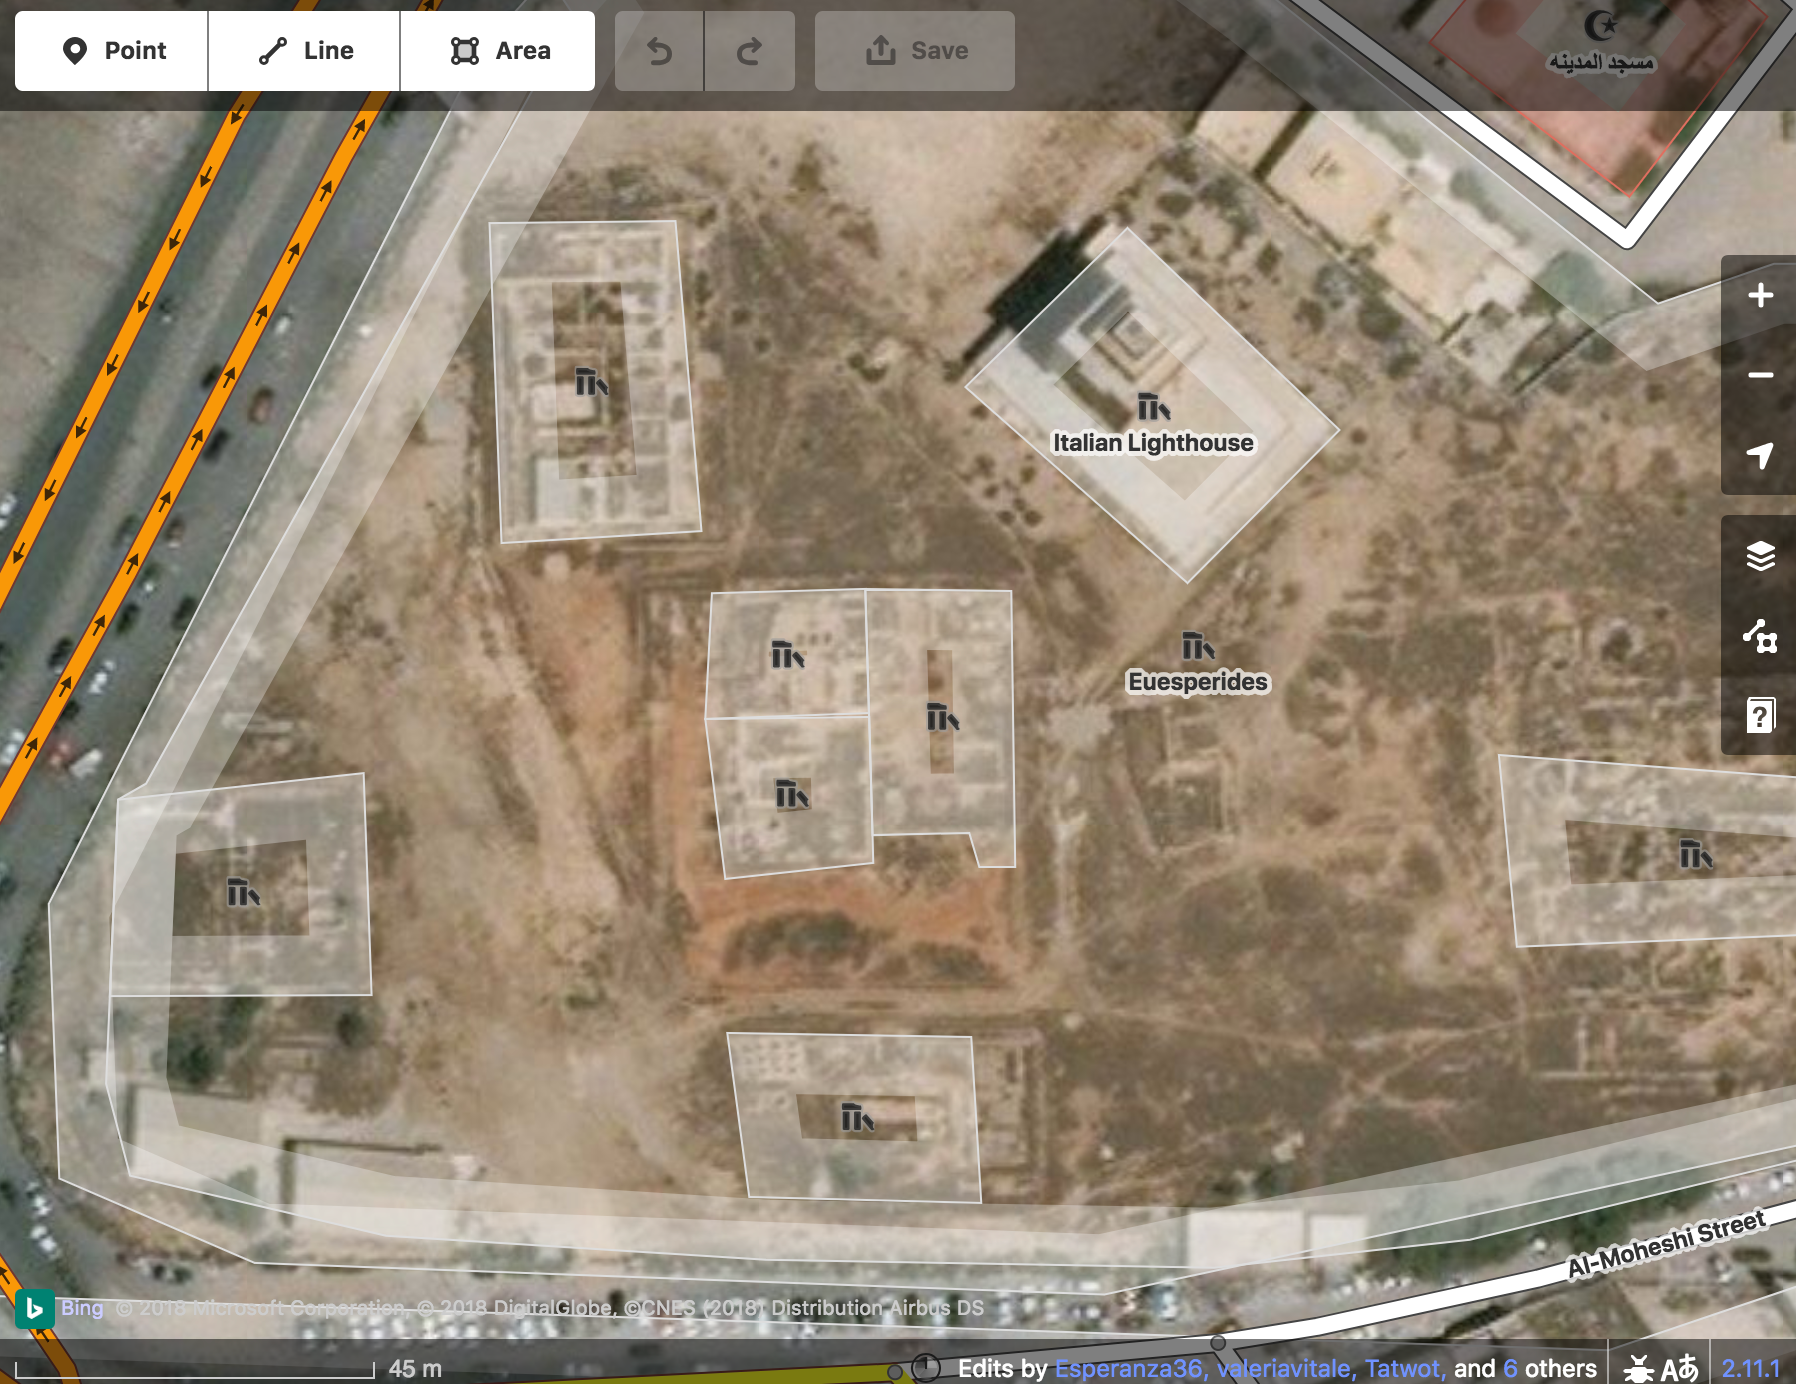
The more scholars and GLAM specialists have used gazetteers, however, the more they have realised that they are often not granular enough for what they want to do. To the ears of a museum professional or archaeologist, hearing that an artefact was found “in Rome” is of use only in the most generic sense. Even smaller places, such as Pompeii or Venice, which have received a lot of academic attention, would benefit greatly from more precise place references within them. In other words, the community which has developed around gazetteers has realised that URIs are needed not only for the city but also for units within it, such as buildings, monuments, squares and other spaces. What is needed is, in our words, an urban gazetteer.
Urban gazetteers would be useful for:
Besides their practical application and their usefulness in bringing together digital resources, urban gazetteers also open up the debate to stimulating questions about the nature of buildings and other urban locations as “places”. Such interesting discussions, however, often present challenges in digital projects and, in particular, in the way we model the data. For example:
None of these questions have an easy answer and this may be one of the reasons why, in spite of the growing interest around them, there seems to be little to no examples of actual urban gazetteers (with the notable exception of MoEML).
So, with a little helpful push from Pelagios (in the form of a small grant), we decided to form a working group of interested people to start tackling this topic. Our goal in creating this community, composed of a mixed group of developers and users of gazetteers, was to make this a collaborative effort from the beginning in order to establish some common working guidelines for anyone working in this field. In addition, we have attempted to strike a balance between those who would like the gazetteers to be as lightweight as possible–basically providing nothing more than a URI to enable connections between external resources–and others who tend to regard gazetteers as the fully-fledged outcome of research–where each entry includes information about the history and evolution of the place, and tries to capture urban places’ fluid identities. In other words, we realised that an urban gazetteer has to harmonise two different elements; to identify and define places within a city and to provide URIs that other digital resources can use.
We did not think that a small group of people should come up with definitive answers and prescriptive guidelines, so we tried instead to involve as many people as possible in the debate in order to identify recurring questions and to gather possible answers. To keep track of our discussion, we started compiling a sort of checklist of things to consider when starting to develop an urban gazetteer. Our checklist involves asking what is the purpose of your endeavour and who are your ideal users. These very fundamental questions that may change the way you design your gazetteer and its features—location(s), attributes, and chronological indicators, for instance. Another key preliminary question is what to include in the gazetteer. The issue is not trivial, as there are almost no precedents to refer to and the level of granularity required can be very different from one project to another. Cities are complex, as complex as miniature worlds and trying to model them systematically and diachronically can feel like a never-ending task. Starting from a subset of the city, either as an area, a time period or a thematic group, could be a more reasonable approach as long as the authors declare their biases.
As happens with other gazetteers, it is very likely that different projects will look at different aspects of the same city. For this reason, it is important that we seek to remain as interoperable as possible. Before starting a new gazetteer, we believe it is best practice to survey what has already been done and when possible, try to build on top of it. For instance, for the major changes in the “lifetime” of a building you may decide to model them as “stages” of the same building or to give each an individual URI and then use relationships to link them all. You can decide that the changes in use also deserve to be recorded or you can focus solely on structural modifications. As for all data models, the key is in finding a balance between richness of information and usability. In this phase we are still building an interested community that wants to share their experience and help us create a catalogue of examples and possible approaches. Our next step is to come up with a simple format, bearing in mind the work currently carried out by the World Historical Gazetteer and aiming at full compatibility with their more general model.
So, there is still a lot of work to do! If you want to make references to buildings in the text you are encoding, if you want to enhance the granularity of the metadata in your digital archive, or if you are just passionate about urban history and the multiple lives of buildings, feel free to go through our document and add your comments and questions. If you have seen a great urban gazetteer let us know how it tackled some of the most recurring issues. Join us in the venture of designing urban gazetteers as useful tools to help establish, represent and query relationships between pieces of cultural heritage, but also as a means to research, model, preserve and compare our knowledge about historical buildings and other urban elements.
This piece discusses the implications of using Recogito as an educational and research tool for history students, with particular reference to the field of Ottoman studies. Having encountered and used Recogito in the context of my own research, I decided to employ it in my teaching. The first experimental application of Recogito was in the context of the postgraduate ‘Spatial history’ seminar during the spring semester of 2018 at the Department of History at Boğaziçi University, Istanbul, Turkey. The seminar addressed a combination of methodological and conceptual issues in thinking about and integrating the role of space in historical analysis and research.
The course introduced Recogito to the students, and part of the assignment was to use the tool in order to map spatial relationships in different kinds of Ottoman historical texts. Students selected a particular Ottoman text that was rich in toponymic data, the visualisation of which through Recogito would reveal patterns and spatial relationships that would otherwise be impossible to discern. The sources used for these student projects included: Ottoman travelogues and contemporary histories; records of the assets of the pious endowments (vakıfs) belonging to the founder of a powerful family of Ottoman statesmen (Köprülü Mehmet pasha); and readers’ letters to Kadınlar Dünaysı (Womens’ world), one of the first Ottoman women’s magazines. In each of these cases, student projects examined the economic, social, political, cultural, or intellectual aspects of their primary sources in relation to space, and what the spatial distribution of different issues revealed with reference to their topic. A major challenge the students encountered was the limited degree of representation of Ottoman toponyms within Recogito’s existing gazetteers. In order deal with this problem, I had submitted a Pelagios Commons Resource Development Grant application, proposing the use of Recogito to test its usability in extracting toponyms from Ottoman historical sources as a stepping stone towards an Ottoman Gazetteer. The project would select a toponym-rich Ottoman text, identify the toponyms which are already part of the gazetteers Recogito uses (Pleiades, part of GeoNames, Digital Atlas of the Roman Empire, etc.), and then compile a list of the missing toponyms for which coordinates and other gazetteer data will be added.
The source we selected was from the so-called ‘Registers of Important Affairs’ (mühimme defterleri). The particular kind of source provides summaries of imperial orders dispatched from Istanbul to the provinces and contain a wealth of toponymic data, covering the whole empire. Within a vast selection of register volumes, we decided to use register number 12, covering the years between 1570-72. The register was published in transcription and facsimile over three volumes by the Ottoman Archives, and available to download in PDF format. Our choice was made according to the following criteria: that this was a period of rapid and important change at the geopolitical level, with wars on different fronts and imperial orders dispatched to meet those challenges. Furthermore, it was during this period that the limits of the empire’s expansion were set and its borders consolidated. Such a source therefore allows us to identify the locations with which the imperial centre was corresponding at a critical juncture in its history. Thus, as both a quantitative (i.e., the number of toponyms contained) and qualitative dataset, the particular source represents an ideal pilot study for shedding light on the internal and external networks that Istanbul had with other places. The register contains more than 900 pages and 1,283 orders. With the initial upload of the text to Recogito, the index was removed in order to avoid duplicates. Each of the team members was allocated a section of the transcribed text with the task of annotating and georeferencing each place name that they encountered.
As this project was under way, I was asked by my department to teach a six-week-long second-year undergraduate historical methods course. The new course I designed was called “Research methods in history: an introduction to digital humanities and spatial history”, and its purpose was to familiarise students with the tools and concepts of spatial history. Following some introductory classes on digital humanities, spatial history, and gazetteers, the course took the form of a hands-on collective annotation session using different texts each week. Three texts were selected for this purpose: Jules Vernes’ Around the World in Eighty Days; Ibn Khaldun’s Mukaddema; and one volume of the Ottoman Important Affairs Registers. During these sessions students learned how to: choose between different gazetteers when annotating a toponym; correctly identify a toponym that appears in different parts of the word according to context of the source; consider time as a factor in annotating and identifying a toponym; and deal with the linguistic and transcription challenges of such a source. Most importantly, students learned how to manually search for an Ottoman toponym through internet and bibliographical sources, and identifying it with their present-day variants. Particularly so in the context of the troubled history of the post-Ottoman lands whereby toponyms are ethnically and linguistically cleansed, this was a lesson not only in gazetteer-compiling or spatial history methods, but also the problems and challenges in verifying or improving the reliability of historical data.
The course was taught twice to two different groups of students, and the results were particularly encouraging. Students were excited and intrigued by the prospect of incorporating technological tools in the classroom, and many of them quickly realised that the tasks involved were much more complicated and challenging than they originally expected. Student feedback emphasised how learning to use Recogito allowed them to better the implications of space in historical analysis, as well as the precision and accuracy required in building a foundational resource such as a gazetteer. Overall, students learned that there is not always a right or wrong answer, but one that depends on particular parameters, contexts, and choices one has to make, and being conscious and explicit about them is the basis of any data compilation exercise.
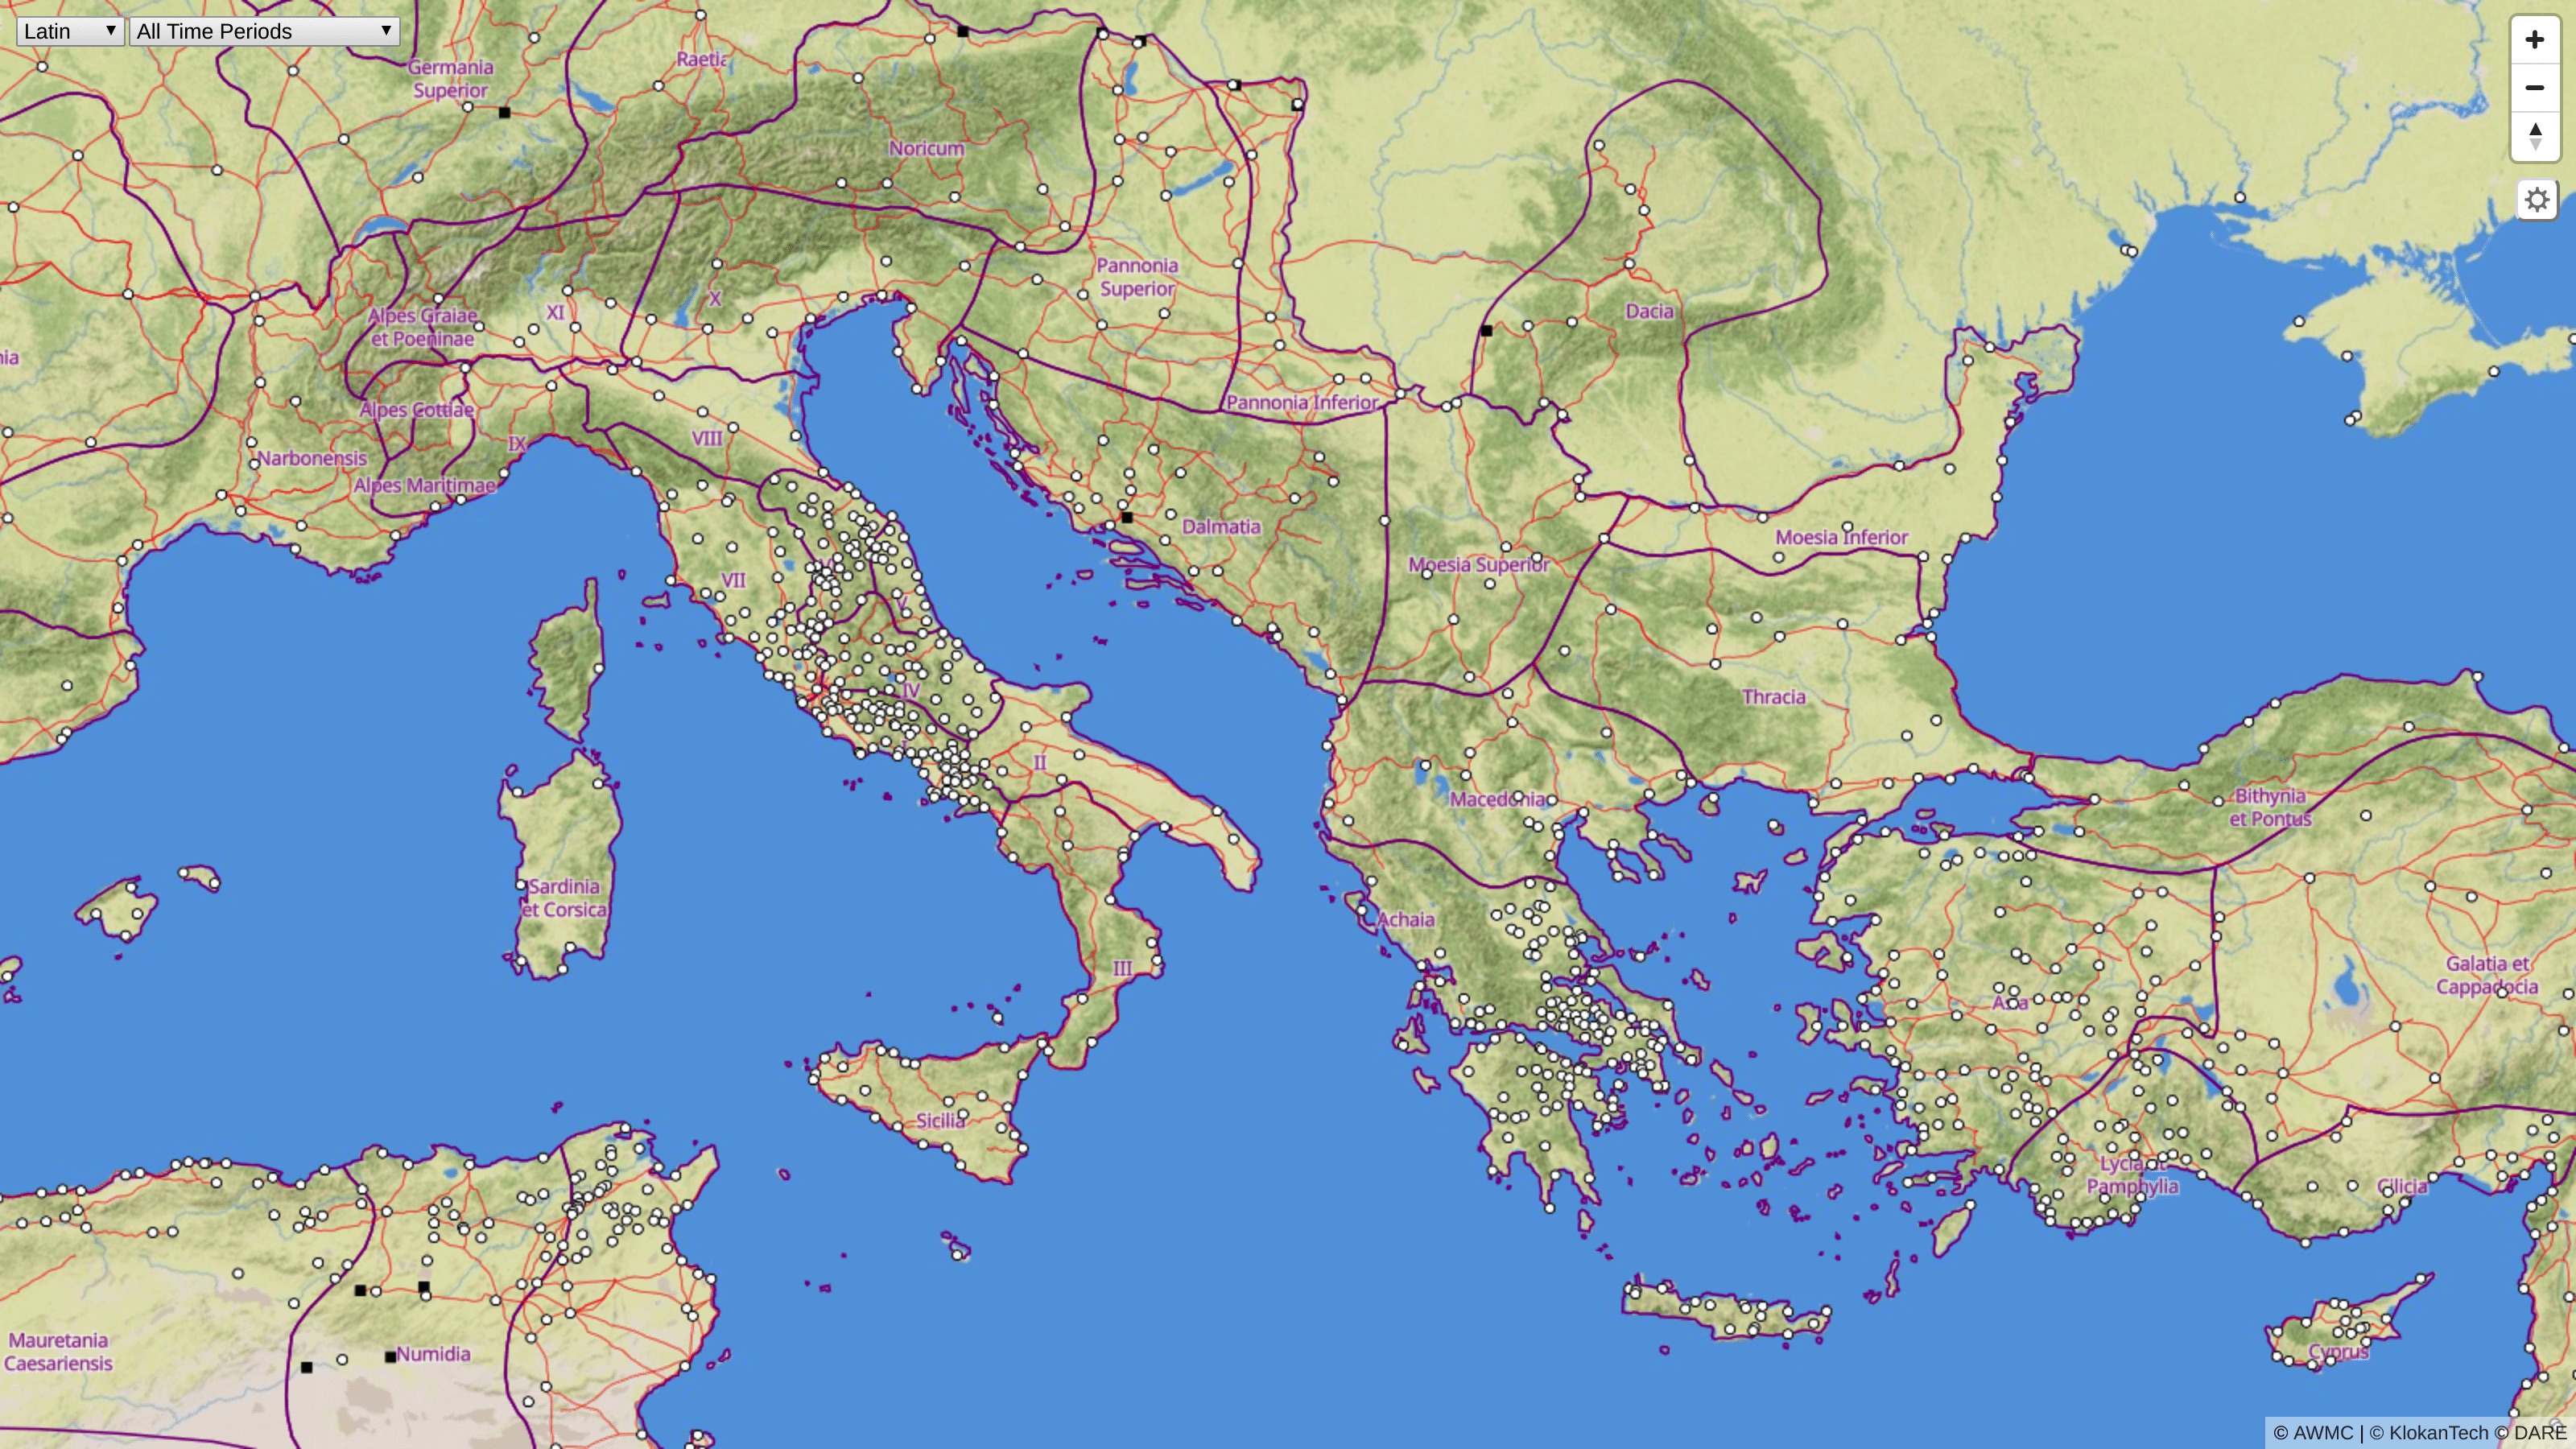
The Roman Empire Vector Map gives people a chance to explore the ancient Mediterranean world as it was during the Roman Empire. They can see much of the road network, discover original place names, and much more with the comfort similar to Google Maps. (For the prototype, see here) A collaborative project of Klokan Technologies and Lund University, supported by a small Pelagios grant, the Roman Empire Vector Map is based on historical data collected by the Pelagios community and the Digital Atlas of the Roman Empire (DARE) project.
The project uses the vector tile technology developed for modern maps visible at https://maptiler.com/maps and applies it to historical geospatial data. Klokan Technologies, which has open-sourced the technology on GitHub, has been working with cultural heritage institutions for years in the effort to build open and easy-to-use mapping resources such as: OldMapsOnline, a gateway into historical map collections around the world; IIIF Hosting which enables lightning fast hosting of large images; and Georeferencer, a crowdsourcing online tool which turns scanned paper maps into map overlays.
Vector tiles for historical data
The main advantage of vector tiles over traditional maps is the ability to personalize and adjust the appearance of the map. Vector maps can quickly change the whole design, highlight selected features, switch the displayed language of the labels, and give each user a more appealing look and feel when moving around the map, based on the context in which the map appears, or the personal profile and preferences of the user (such as places of personal interest, preferred language, etc.). A minimal amount of vector data is transferred to the client (usually a web browser or a mobile app) to enable such changes to be made.
The essential advantage of vector tiles for historical data is the ability to display or remove selected features on the map depending on the chosen time period. Essentially, vector tiles allow the display of changes in time without the need to reload the data or an entire website. As a result, it scales well for big data —with billions of features — and can work with detailed maps covering massive areas (including the whole Earth).
Vector tiles are a natural evolution from the traditional raster maps, where the map tiles divide the geographic regions to small tiles. More technical information about map tiles can be found here.
The goal of the prototype map for the Roman Empire was to create and test a digital model which was both open-source and flexible enough for reuse by researchers, teachers or general enthusiasts wishing to display historical data.
Generating vector tiles from GIS data
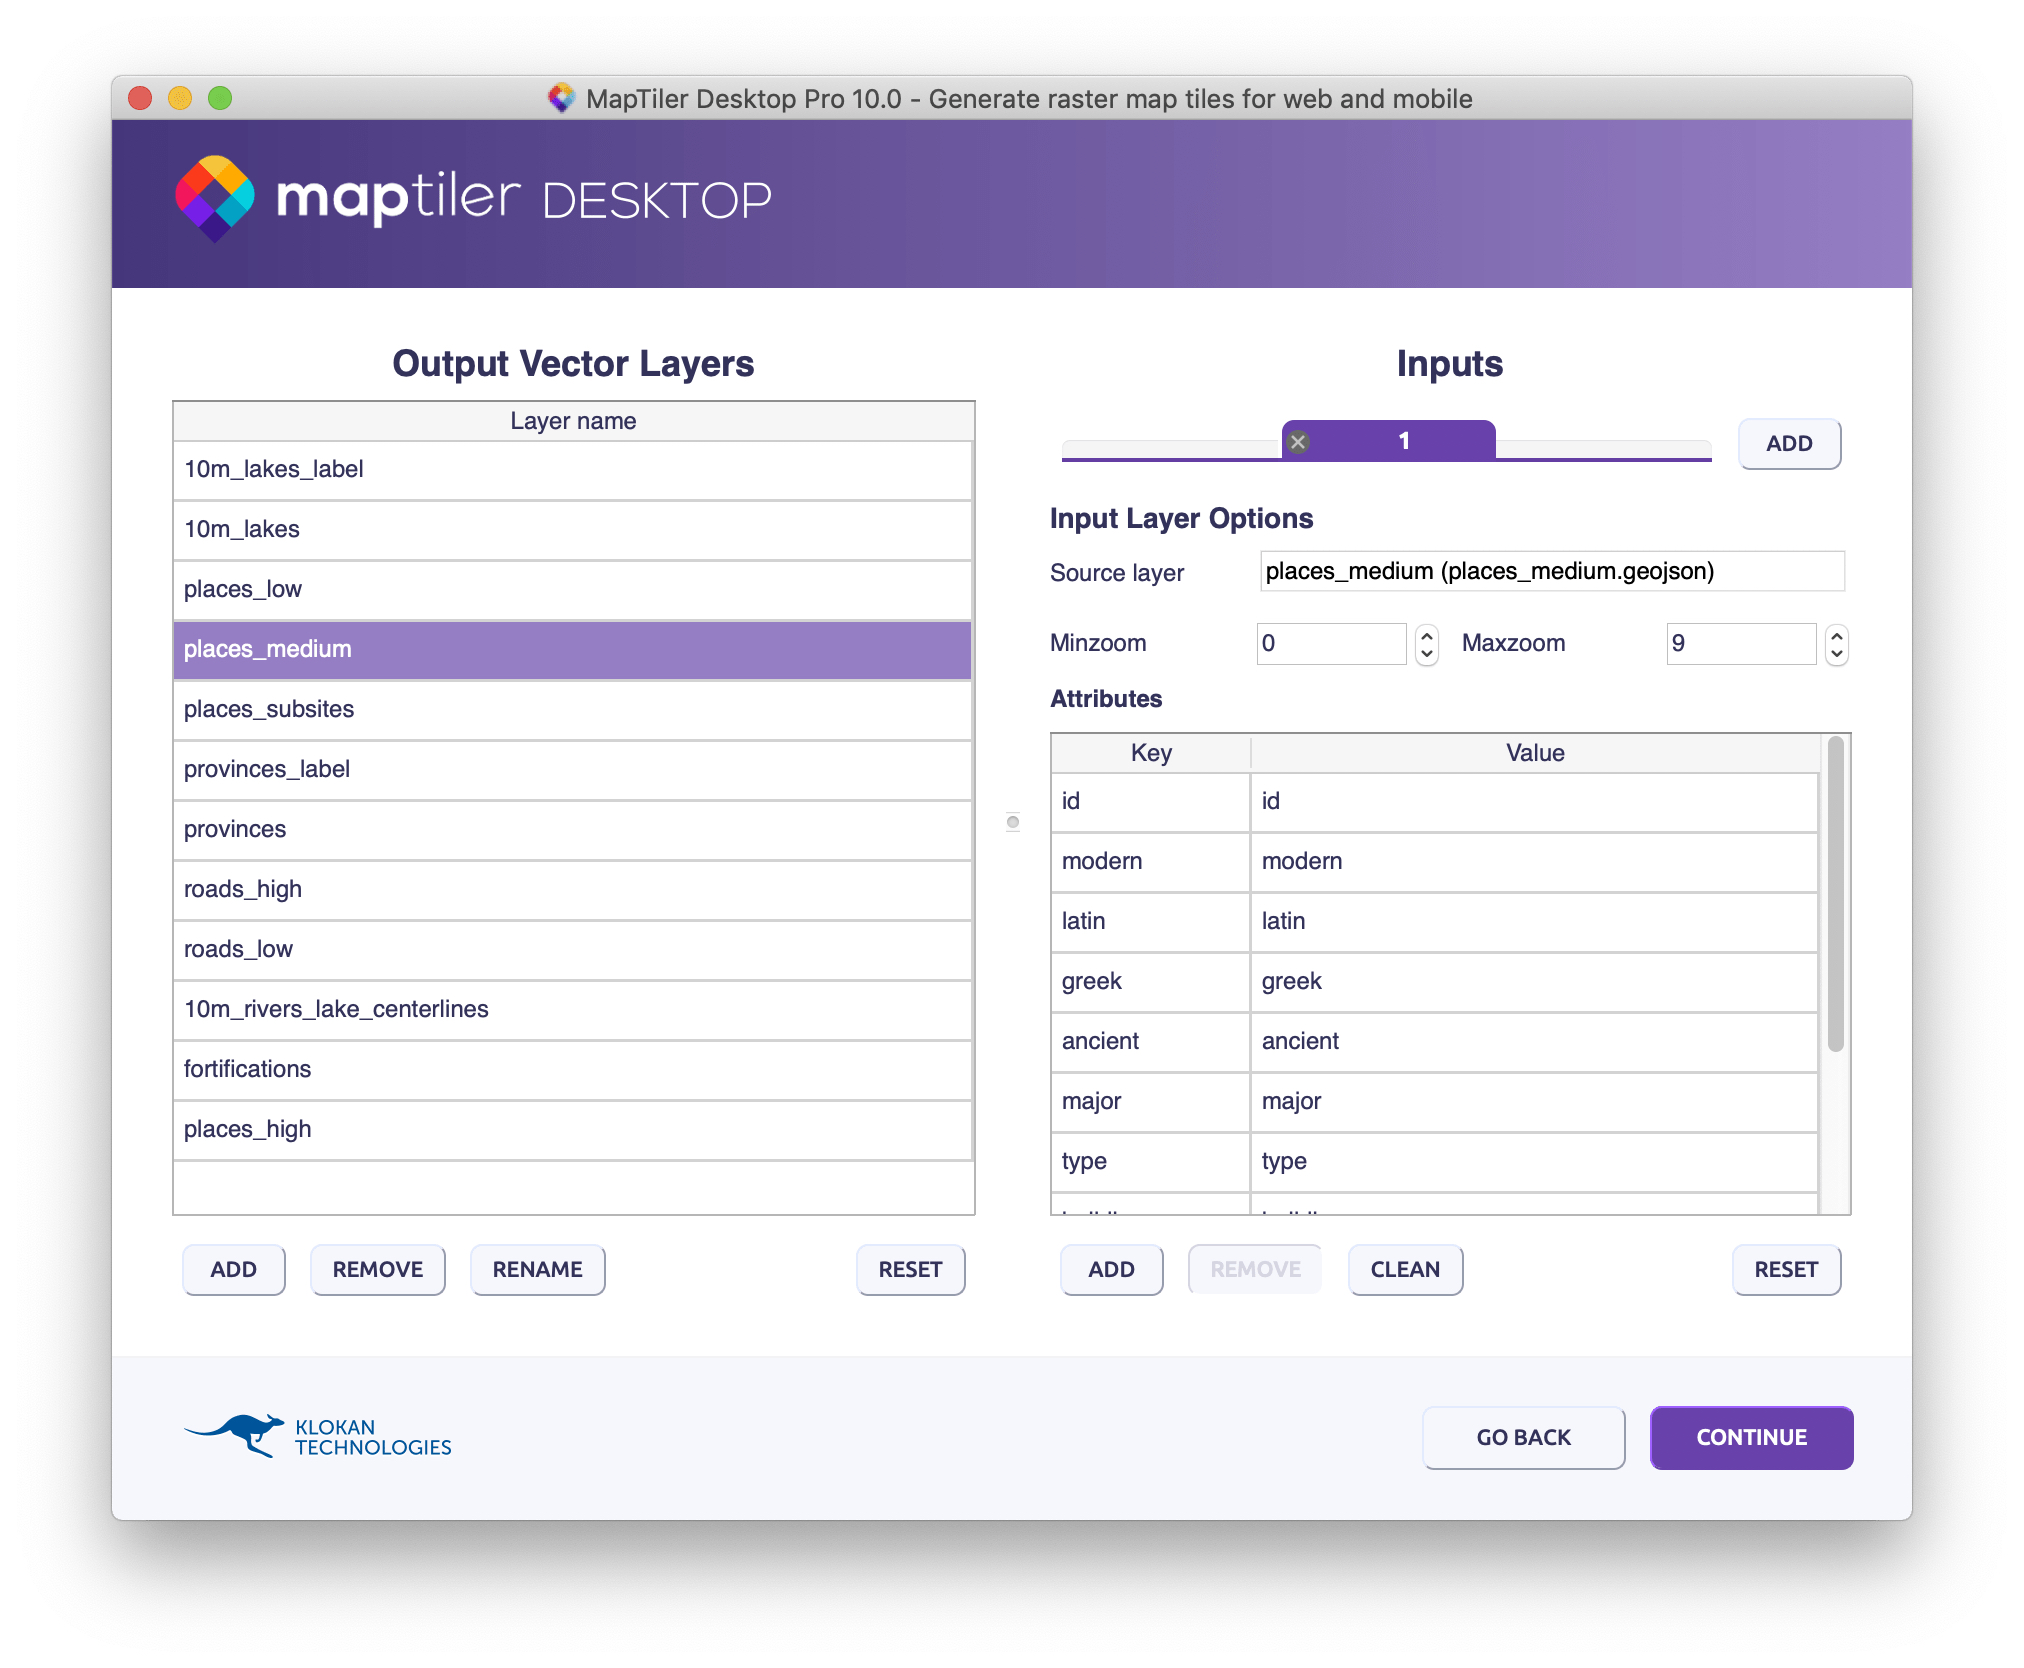
The historical geospatial data are usually edited using desktop GIS software or web tools. In the Roman Empire Vector Map project, all the source data have an open license. All vector layers have been converted to the GeoJSON format of the WGS84 coordinate system. They can be explored here in the “data” directory. The input layers for the map includes a subset of attributes for places, roads, fortifications and provinces — with low, medium and high details for different zoom levels. Among the input files are also the icons that represents these various types of place or objects in space.
The vector generating process can be easily done using MapTiler Desktop software. Input files are data in GeoJSON or other vector formats, and the output tiles are in MBTiles format—technically a SQLite database. MapTiler Desktop offers the ability to: merge multiple sources; edit various attributes; set zoom levels for each attribute; and change the order of attributes in the final map. Since it runs in a graphical user interface, it is more accessible to a broad audience. There is also a command-line version of the software for automation and integration into a workflow called MapTiler Engine.
Vector tiles can also be generated using other software, including open-source tools like mapnik-vector-tile via tilelive, tippecanoe or others. However, these tools have a steeper learning curve, usually demand a longer generating period, and do not come with a graphical user interface and installer for Windows or Mac.
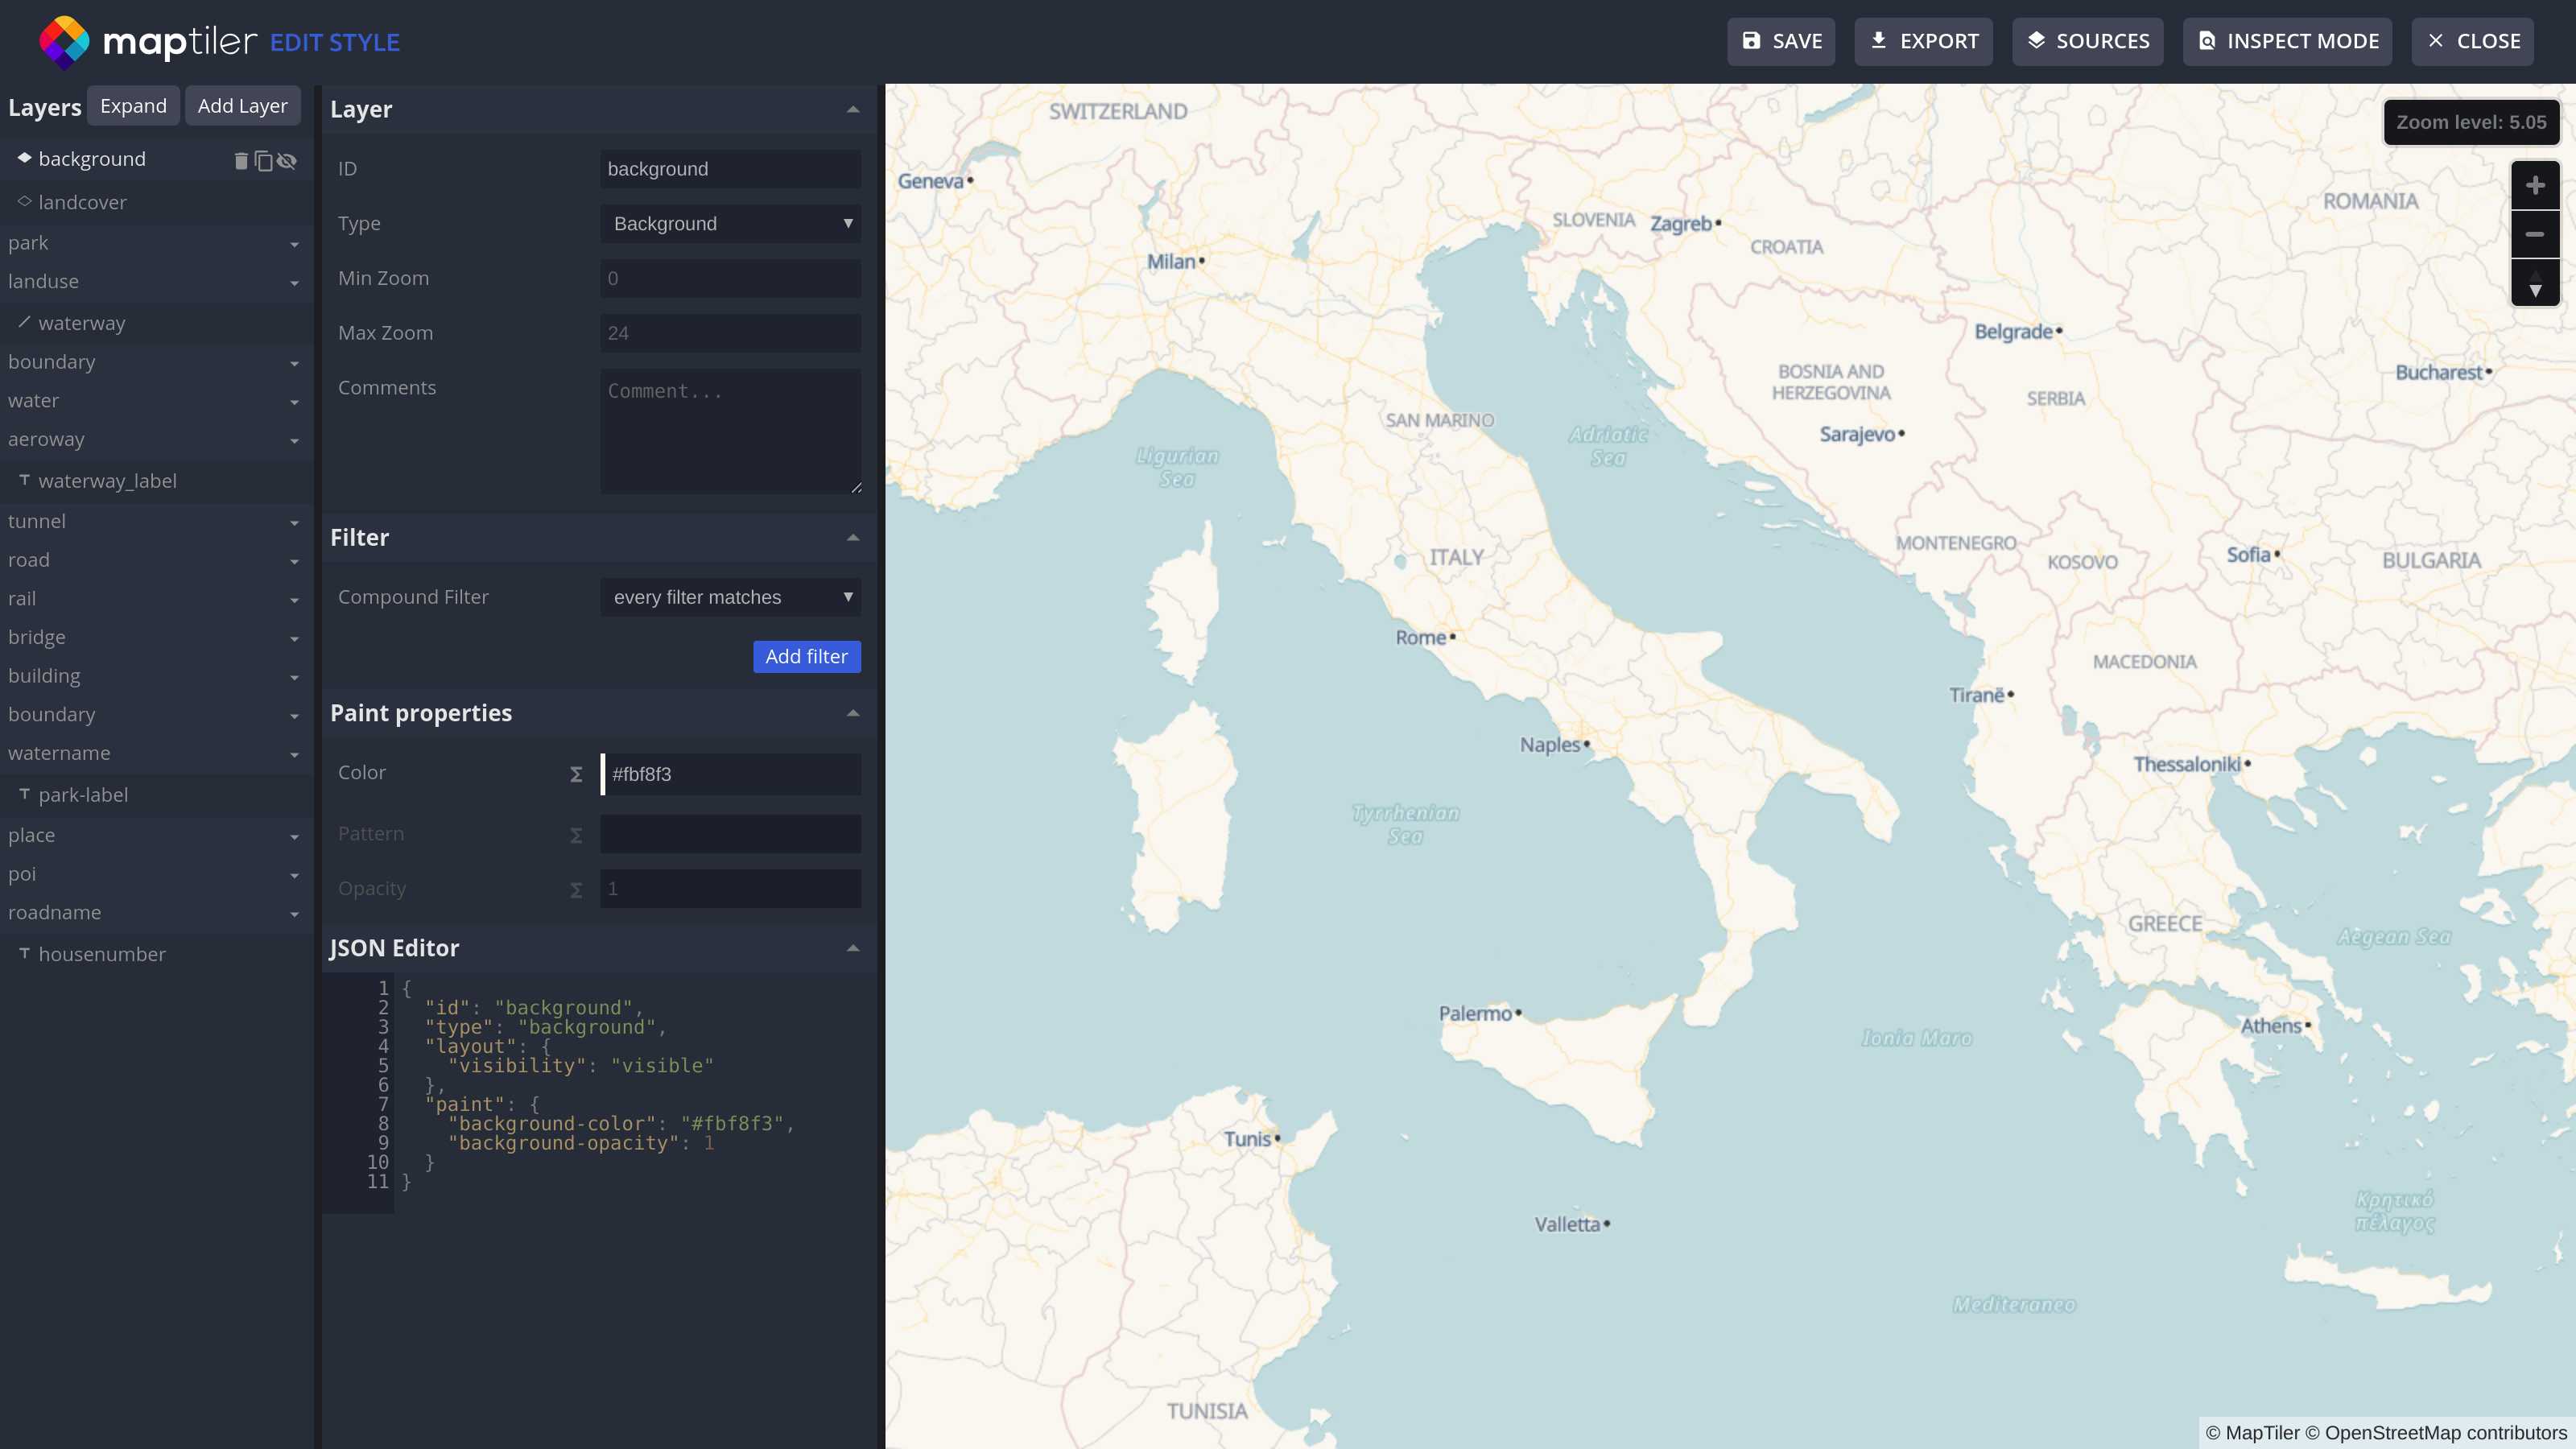
Map styling and publishing
Before the map is presented to end-users, it is necessary to define a map style. This is a file which says how each element should be represented on the final map, e.g., what colour should be used for painting a road, what symbol should be used for fortification, etc.
There are specialized map hosting services where you can upload your data in MBTiles format and style them within a graphical user interface. One of them is MapTiler Cloud. Since it runs from a cached global infrastructure, it has a low load latency. Styling is done with a graphical style editing tool, where each map element can be designed in an on-the-fly preview mode. It is also possible to upload a style in a JSON format and make further changes in the graphical editor. Apart from displaying the map in the browser or mobile apps, it provides a map service for use in desktop GIS software.
An alternative is to host the MBTiles file on any web hosting or cloud service. If there is a need for raster tiles and map services, one can use tools like TileServer GL developed by Klokan Technologies and released as open-source. Together with the data, it is necessary to prepare a config file in JSON format. This can be done using any text editor.
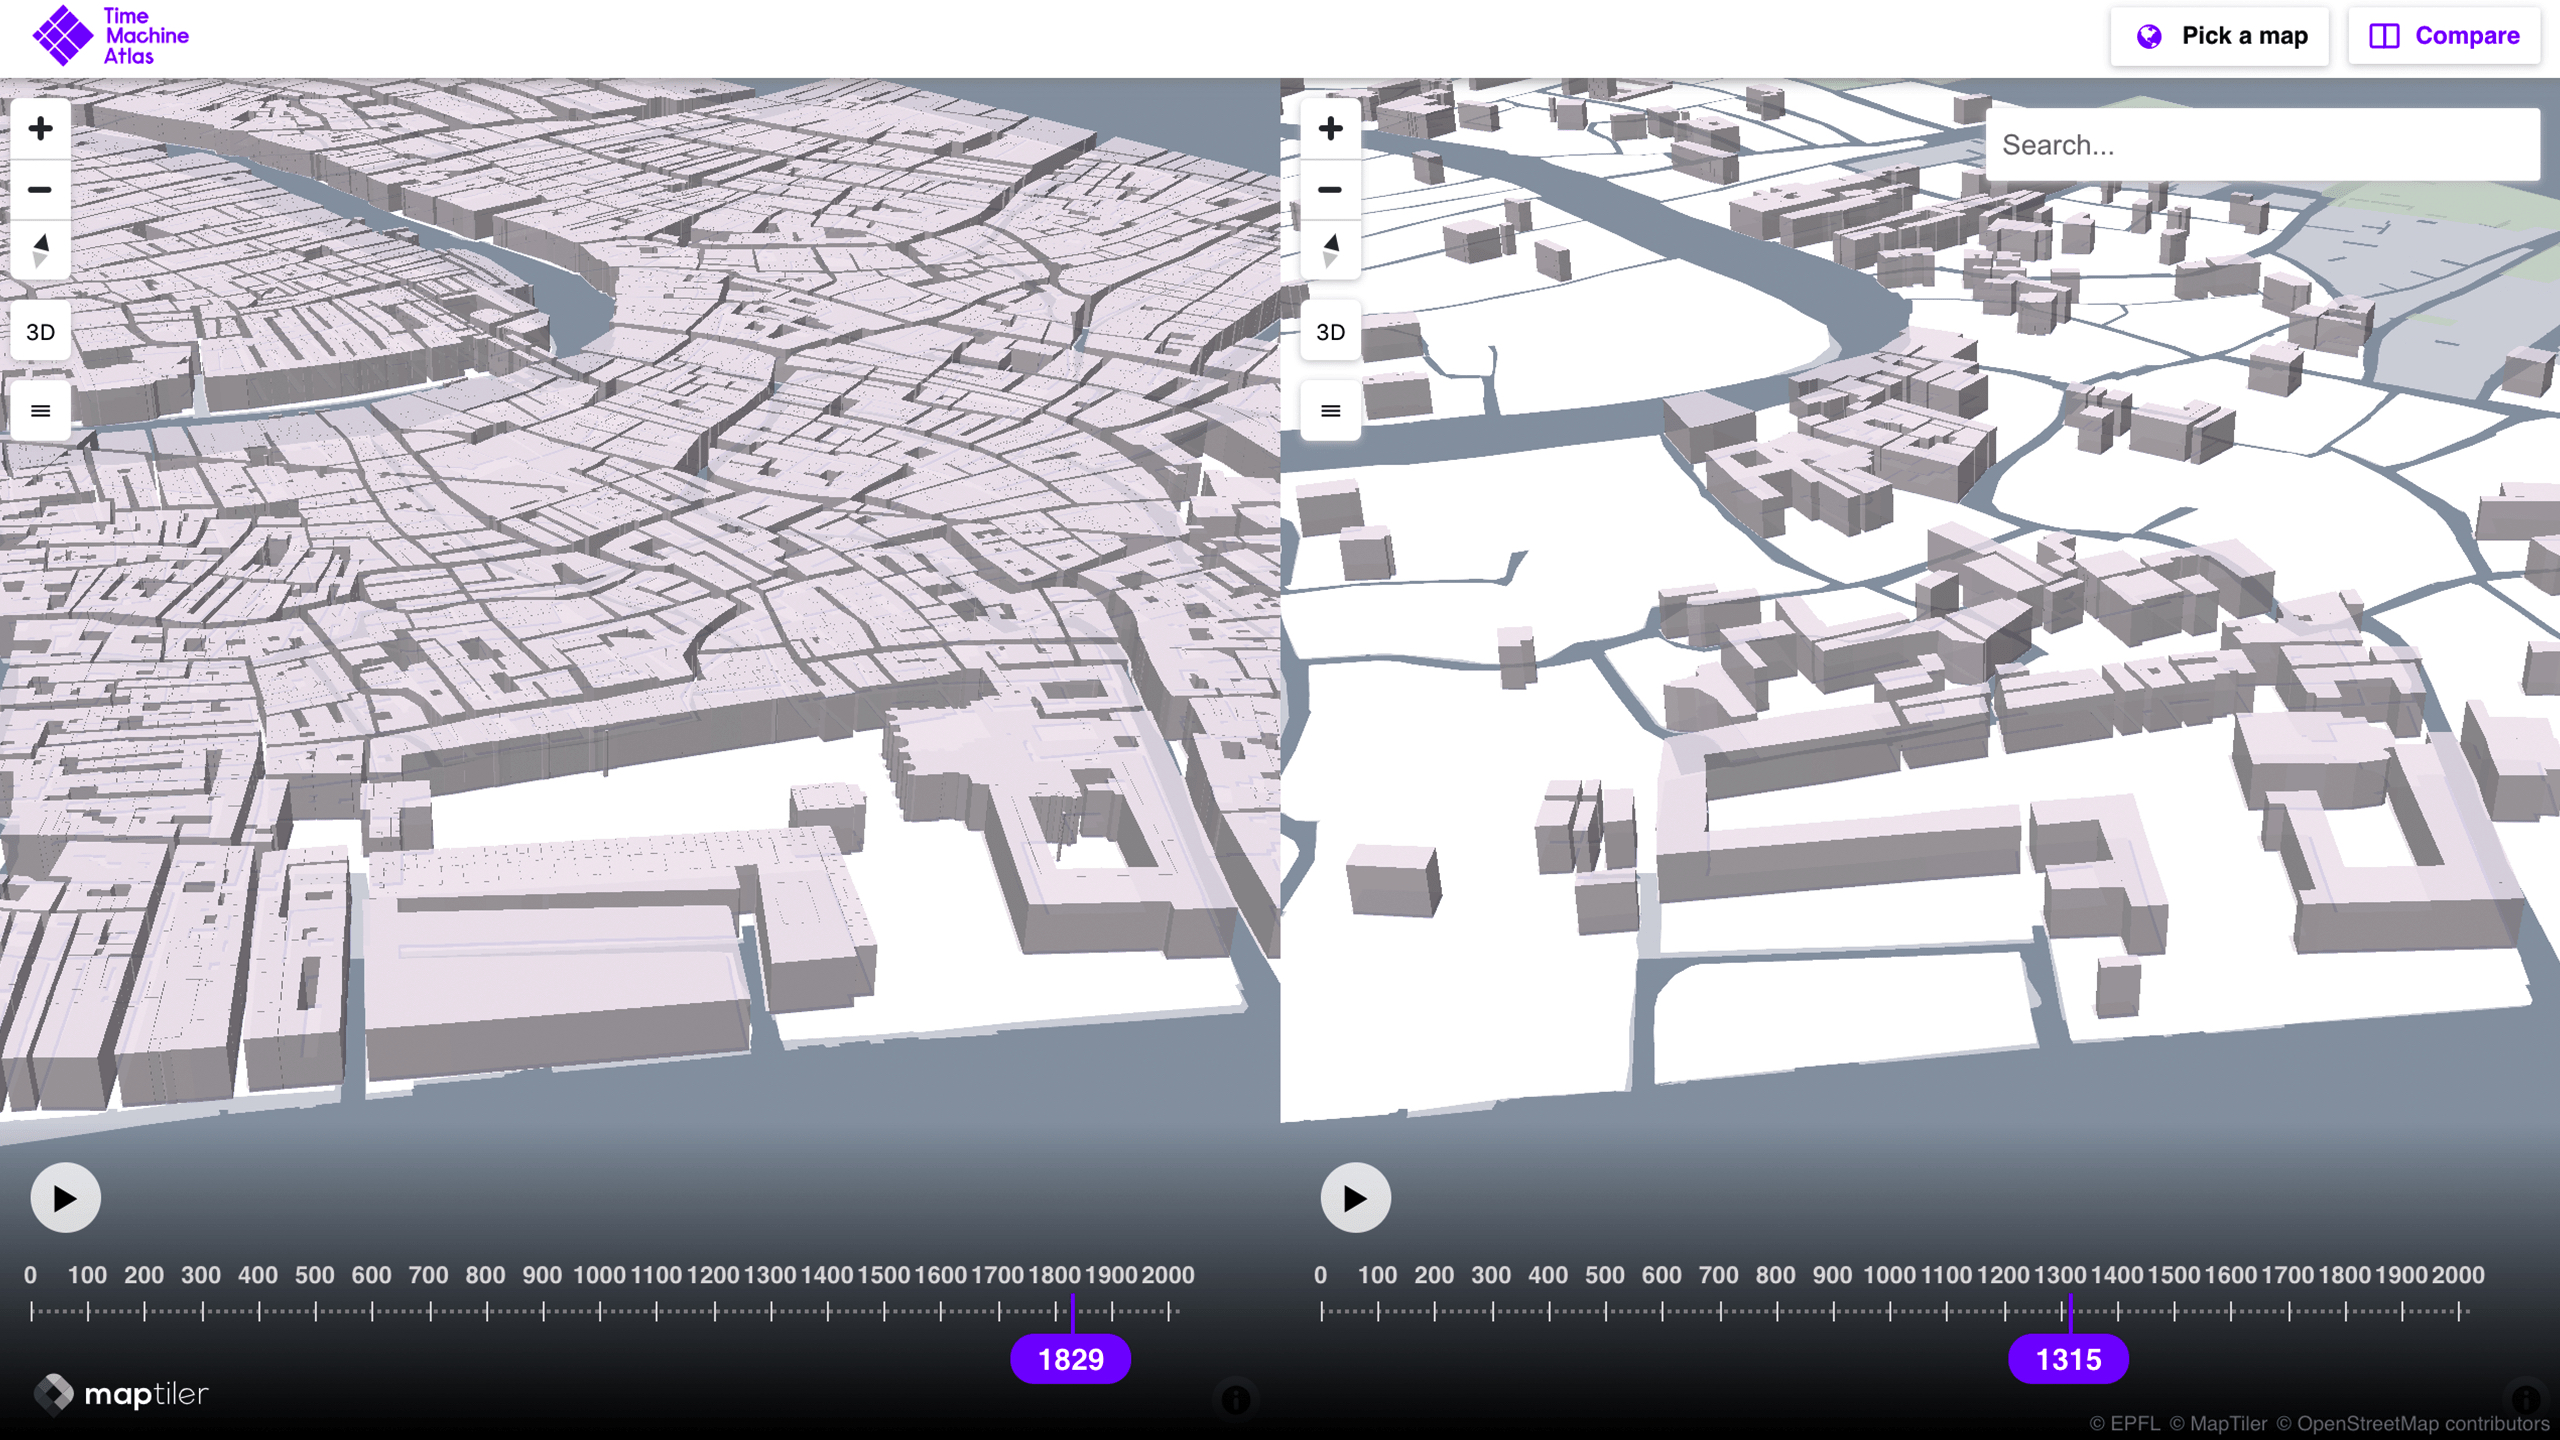
From an end-user perspective, changes on the vector map can be made based on a time period to be selected from the drop-down menu. For example, the Roman Empire Vector Map contains place name labels in Latin, Greek and modern names in language predominantly spoken in the specific area, the selection of which is made by the end user using the drop-down menu. Currently, this menu offers five time periods plus an “All Time Periods” option. In the future we may replace the drop-down menu with timeline functionality, such as can already be seen in use in our new TimeMachine Atlas project, where the end-user can move forward or back in time and see the map dynamically change accordingly. On the time axis, one can also watch the exact year, stop the time flow, or move to a selected year.
Conclusion
The project demonstrates many advantages of the vector tiles technology and its flexibility to work with historical data. The same digital model is used by other projects like the Venice demo for the TimeMachine.eu project https://timemachineatlas.eu/, which introduced further enhancements for end-users.
The Roman Empire Vector Map prototype is available at https://labs.maptiler.com/roman-empire/.
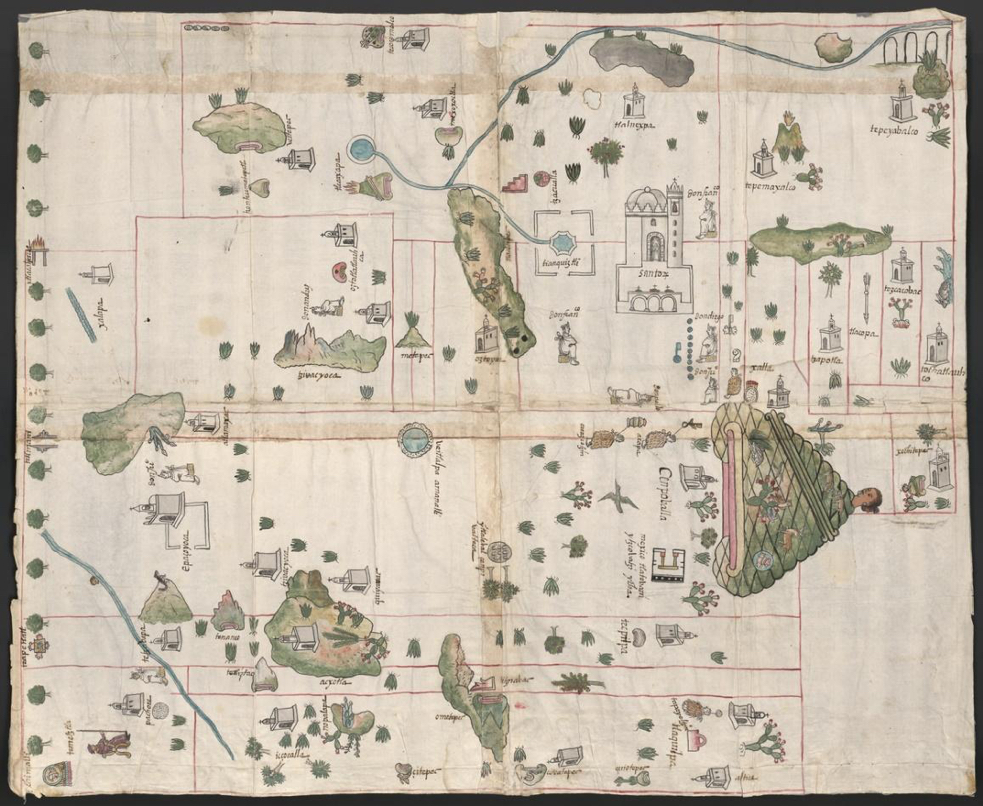
In 1577, King Philip II of Spain, decreed an ordinance to collect a variety of economic, social and political information about the Spanish realm through a 50-chapter questionnaire. This included the territory of the Viceroyalty of New Spain, part of what is today Mexico and Central America. While the questionnaire sent to every town and village aimed to gather data which would be useful to the crown – including, but not limited to, exploitable resources such as minerals, plants and products as well as information on the history and organisation of indigenous society. This endeavour resulted in the compilation of the now surviving 168 reports, a corpus of 2.8 million words written in Spanish, peppered with around 69 different indigenous languages [1]. – it also aimed to collect scientific measurements and geographic information in the form of maps. Questions 10, 42, and 47 requested the creation of some form of plan or painting, showing a variety of geographic information such as streets, towns and villages, ports, coasts, islands, or anything relevant to the local geographies. While the orchestrator of the questionnaire, the chronicler cosmographer of the Indies Juan López de Velasco expected to receive maps created in the western tradition, what he got back instead was a completely unexpected new form of hybrid cartographic representation: the pinturas (paintings, also referred to as ‘maps’) of what would be called the Relaciones Geográficas de la Nueva España (hereafter RGs).
Each of these paintings offers a unique reflection on sixteenth-century settlements in Mexico. Composed within a complex interwoven ideology including indigenous and European techniques, these paintings convey social and cultural ideas, representing space and place in numerous ways, many of which may be unfamiliar to the modern eye.
Our project ‘Digging into Early Colonial Mexico: A large-scale computational analysis of sixteenth-century historical sources’ (DECM) is developing novel methods and tools for mining data from both textual and pictorial historical records. Through a combination of techniques using Geographical Information Systems (GIS), Natural Language Processing (NLP), and Machine Learning, the project aims to create news ways of answering vital research questions which would previously have required a lifetime of investigation. We are experimenting with NLP annotation models to enable the automatic extraction of information by topic, as well as the automated recognition of proper names including toponyms, institutions and people’s names, among others. We are also in the process of creating the first digital 16th century gazetteer of New Spain through the semi-automated extraction and disambiguation of place-names from a number of historical secondary and primary sources. We have also created a full historical dataset in GIS of relevant geographic data such as territorial divisions during the 16th century including provinces, dioceses, etc. This will soon facilitate all sorts of spatial analyses.
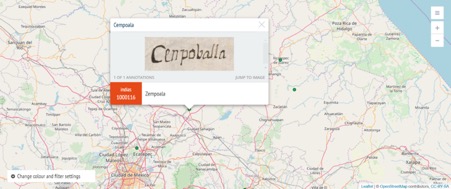
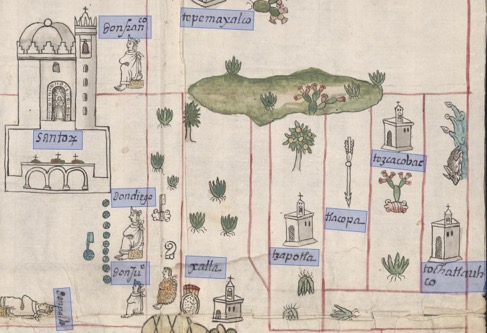
In the case of the pinturas, we are also aiming to use annotation and image processing techniques in combination with machine learning. These present a set of fascinating challenges, and using Recogito is one of the approaches we aim to use to address these. The pintura of Cempoala (Fig. 1), for example, combines both European and indigenous techniques, featuring both glosses (text) of place-names written in Spanish, as well as glyphs in the indigenous tradition. These might also tell the reader the toponym of the settlement (through its glyph), provided they have an understanding of the indigenous writing and histories present on the map. Nor is this interplay of European and indigenous styles unique to the Cempoala map – indeed, it features on the majority of maps created for the RGs, but also on other maps produced from the sixteenth-century onwards, including cadastral maps produced to substantiate indigenous land claims.
Place-names and spatial organisation are not the only pieces of information contained within these paintings. There is a great variety across the corpus of 78 RG paintings alone. Historical information is embedded within many of the pinturas, either through genealogical histories depicted in a style similar to that of indigenous Codices (such as the pre-Hispanic Codex Zouche Nutall or the colonial Codex Mendoza), the depiction of rulers, or within the place-name glyphs themselves. These are just a few examples of the kinds of information present in these paintings, and, despite a great deal of research, there is still much to learn from these unique resources.
It is undeniable that the paintings of the RGs contain a great variety of both textual and pictographic information, which offer invaluable insight into the historical and geographical contexts in which these pinturas were produced. Recogito offers the opportunity to analyse this wealth of information in a new and innovative way. We have recently begun the process of annotating some of the RG maps using Recogito, which we hope will enable us to not only identify and extract information depicted on these, but also interact with this information in a way which would not be possible without computational methods.
One of the features which will be particularly interesting for this process will be Recogito’s Map View, which will allow us, using our own or other gazetteers, to geographically locate (where identifiable) the sixteenth-century places depicted on the RG maps. For example, this has the potential to highlight the alternate ways in which space is represented on the paintings. Distances between settlements, for example, are often depicted in ways that may be unfamiliar to the modern reader. Barbara Mundy, a leading art historian who has been at the forefront of research into the maps of the RGs in recent years, employed the term ‘communicentric projection’ to describe how these maps often arrange settlements on the map based upon the significance of the role of the community, rather than solely their geographic, physical location [2].
Of course, one of the inevitable issues of investigating historic geographies is the fact that many place-names have evolved and, in many cases, completely changed over time. Identification of place-names is an ongoing challenge within the DECM project, and if you would like to read a little more about how we are addressing these issues using computational techniques, click here
Annotating the RG maps using Recogito offers a prime opportunity to test the capability of these kinds of tools in handling rich, and varied, historical source material. Adopting Recogito for the analysis of these maps will, we hope, offer new insights into perceptions of space and place across sixteenth-century Mexico from both an indigenous and European perspective, as well as demonstrating the value of computational approaches more broadly as a tool for historical enquiry.
References
[1] Harvey, H.R. (1972) The Relaciones Geográficas, 1579-1586: Native Languages. IN Wauchope, R., and Cline, H. (eds) Handbook of Middle American Indians. Guide to Ethnohistorical Sources, Part One. Vol. 12. University of Texas Press.
[2] Mundy, B. (1996) The mapping of New Spain: Indigenous cartography and the maps of the Relaciones Geográficas. Chicago: University of Chicago Press.
With the integration of computational methods in humanities research, come computational evaluation methods. The language technology community has a longstanding tradition of corpus-based evaluations [1] as well as data annotation practices [2]. In interdisciplinary digital humanities research projects, we are starting to integrate some of these evaluation methods using Recogito. This piece will explain why we chose Recogito and how we are stretching its use to fit our needs.
At the Royal Netherlands Academy of Arts and Sciences Humanities Cluster’s Digital Humanities Lab, we are working on advancing humanities research through digital methods with a specific focus on automatic text analysis. In two projects, we currently use Recogito to manually annotate texts which then compare to our automated methods.
EviDENce: Ego Documents Events modelliNg - how individuals recall mass violence
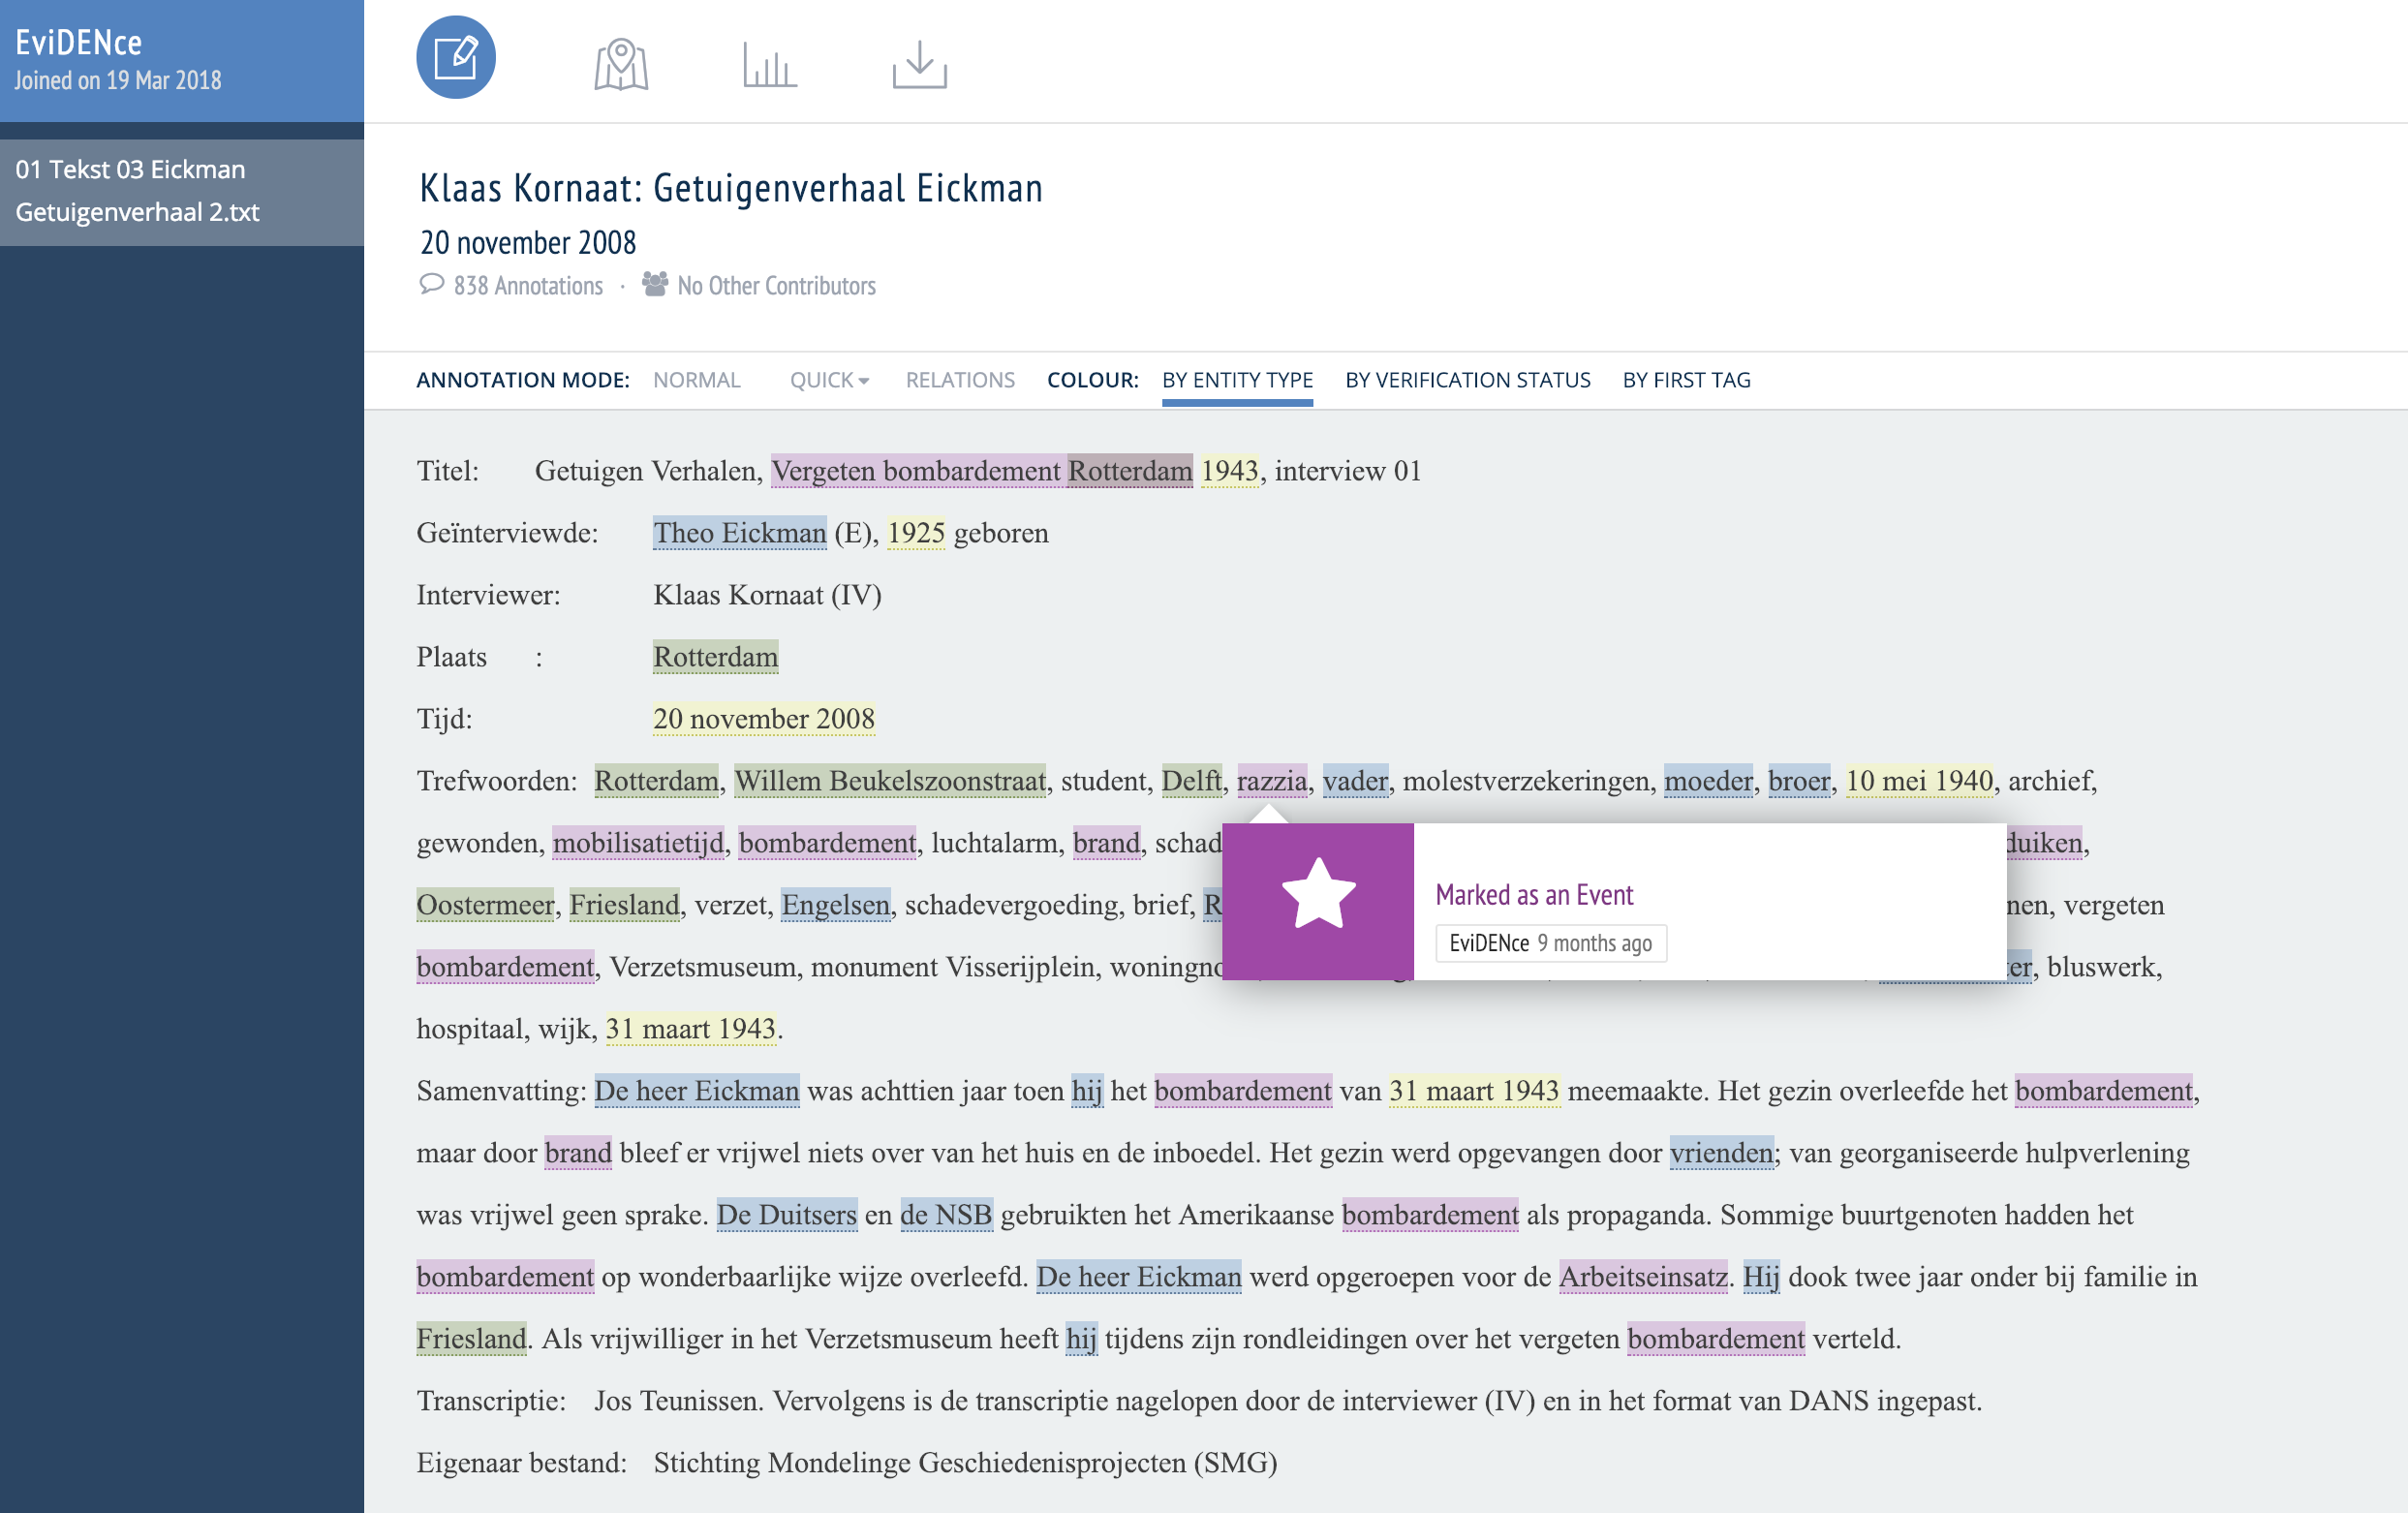
In the EviDENce project, we work with historians and eScience engineers to investigate how the perception of the concept of ‘violence’ changes over time through eyewitness reports and ego-documents (ego documents are texts in which the personal life and experiences of the author play an important and central role such as diaries, autobiographies and memoirs). In the first year of the project, we focused on transcribed WWII eyewitness interviews and we investigated how suitable state-of-the-art language technology pipelines are for the purposes of extracting relevant information from these interview texts.
One glitch is that in our project, we are interested in events, places, people, time and emotions, and only the first three are available as entity types in Recogito. We found a way around this by labelling time and emotions using the ‘tag’ option in Recogito, which provides us with a way to annotate items outside the predefined categories.
In comparing our manual Recogito annotations to automatic annotations by Frog [3] and the NewsReader pipeline [4], we found that off-the-shelf named entity recognisers have difficulties with domain-specific terms as well as the granularity of places.
Being able to compare a manual annotation to an automatic annotation side-by-side helped us bridge the gap between what historians deem relevant in texts and what our current state-of-the-art tools can recognise explicit [5].
As we had good experiences with a flexible reuse of Recogito, we also decided to use it in a different project: the Historical Recipe Web in which we automatically extract recipes from historical newspapers to gain insights into trends in food culture.
Historical Recipe Web
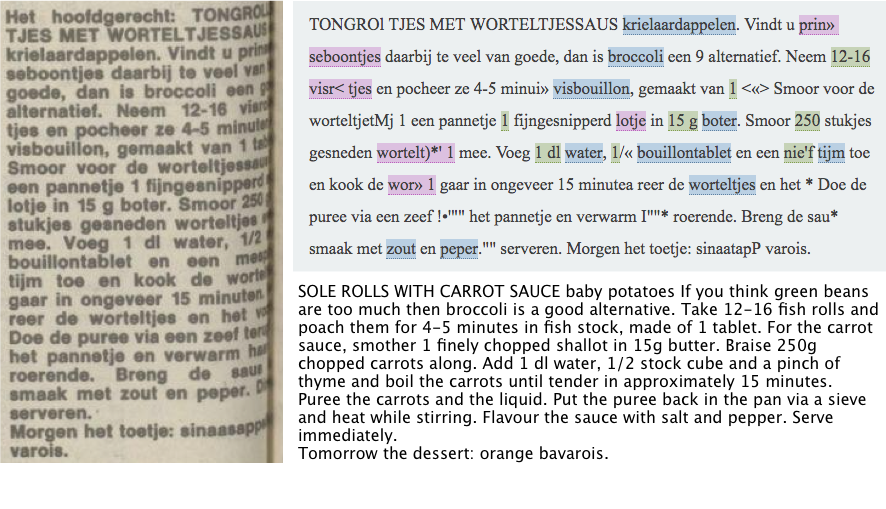
We were looking for a quick way to annotate a set of newspaper recipes with “ingredients”, “potential ingredients”, and “quantities” to evaluate an automatic recipe analyser on. The “potential ingredients” category denotes strings that most likely denote an ingredient but are not correctly recognised by the OCR software. We included this category to be able to evaluate the impact of OCR errors in our experiments. Figure 2 illustrates an example annotation. The newspaper scan on the left shows that the page is folded and some words are difficult to read.
Clearly, ‘ingredient’, ‘quantity’, and ‘potential ingredient’ are not standard Recogito categories, but by ‘using’ the Person tag (blue) for ingredients, the Event tag (pink) for potential ingredients, and the Location tag (green) for quantities, we could find a reasonable work-around. In a short timeframe we were thus able to annotate 100 articles against which we could evaluate our system. Among these were 6 articles that were annotated by all three annotators, which enabled us to evaluate the inter-annotator-agreement. The evaluation was not done within Recogito itself, but via a CSV export from Reogito which we subsequently ran through additional Python scripts.
Conclusion
Annotating evaluation datasets is usually a time-consuming task, and one that can take up even more time when not using an optimal tool. Whilst there are many tools around that provide myriad options, we believe that projects are best served by an intuitive tool that does not require complex configurations and installation processes. For our digital humanities projects, we ‘extended annotation beyond Recogito’s core entity types because the platform was so easy and attractive to use.
Acknowledgments
EviDENCe is funded by the CLARIAH- CORE project financed by NWO: http://www.clariah.nl.
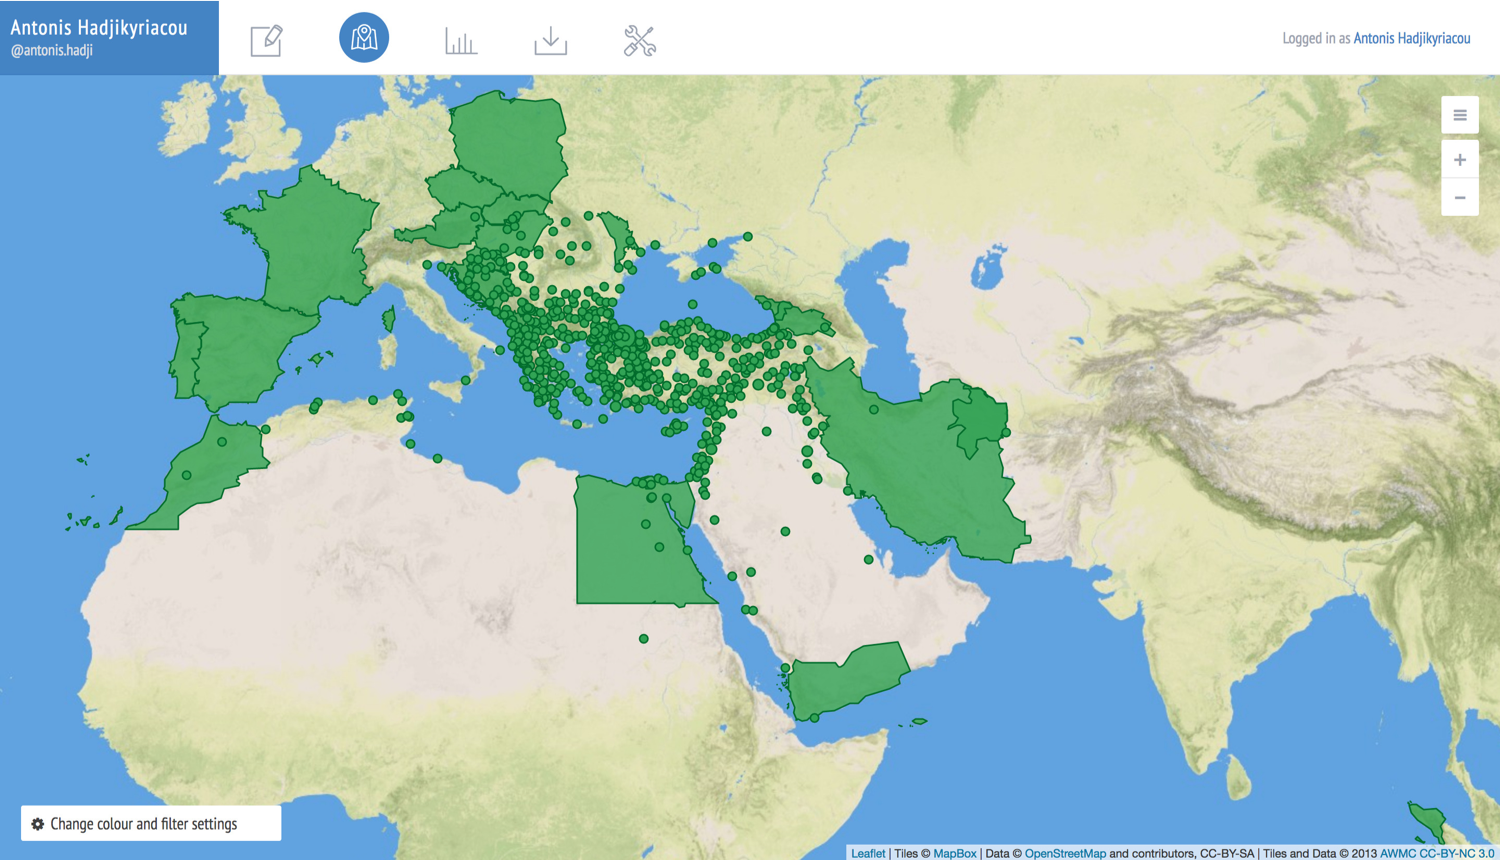
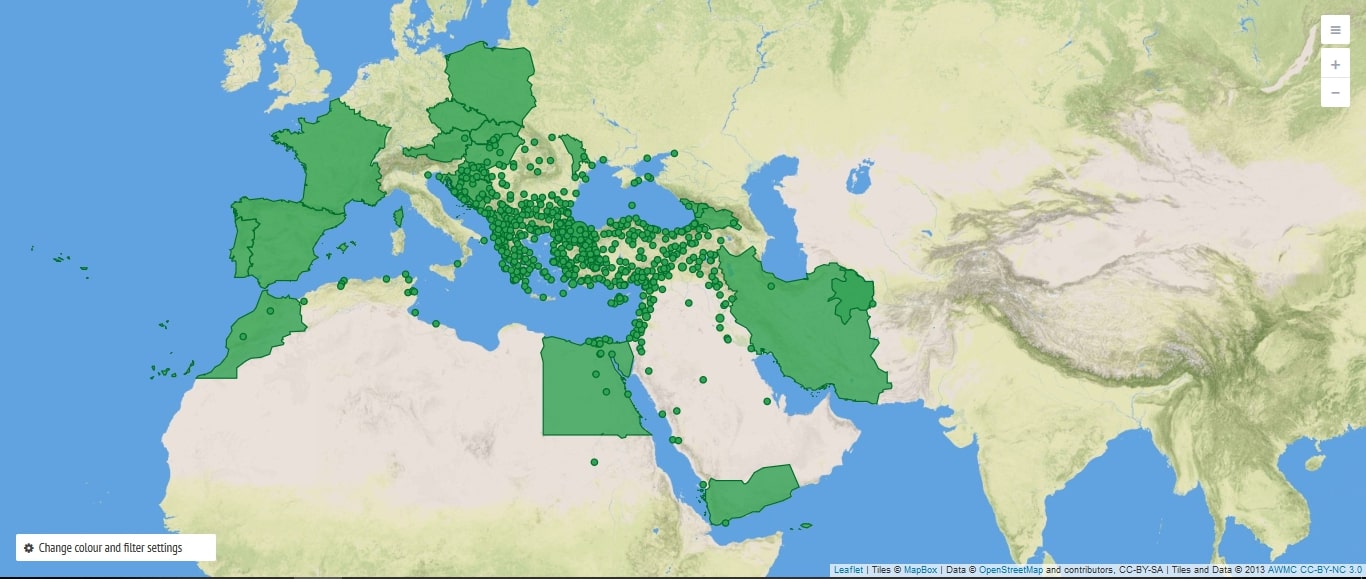
The starting point for the Ottoman Recogito (OttRec) was an inquiry into the applicability of Recogito for the purposes of building a digital Ottoman gazetteer with the use of Ottoman sources. Having considered many sources from different periods, we decided to use the so-called ‘Registers of Important Affairs’ (mühimme defterleri), which contain imperial orders dispatched from the capital (Istanbul) to the provinces. There is a total of 419 volumes covering the years 1553–1915. Some of these volumes are available in transcription and in digital format, and we chose to work on volume no.12. This volume covers the years 1570-1572, and contains 1,283 orders. Our selection of this volume was determined by both qualitative and quantitative criteria. This was a period of rapid and important changes at the geopolitical level. It was during this time that the limits of the empire’s expansion were gradually being consolidated. Quantitatively, this meant that the particular volume had a large number of toponyms, which would make it ideal to start collecting Ottoman place names.
The result was 10,812 annotations: 8,213 place names and 2,347 people. Of the 8,213 annotated places, we identified 647 unique toponyms, while another 390 remain unidentified. The next step is to identify the toponyms that were not on the existing gazeteers that Recogito uses. The top-five most frequently-encountered toponyms are: Istanbul (1,335), Cyprus (330), Damascus (159), Baghdad (135) and Rhodes (114) (Figure 1). Since this was the period of the Cyprus expedition, these results were neither unexpected nor a coincidence. Rather than being the statistical and visual representation of our specific source, we tend to interpret these outcomes as a locus for apprehending the history of the Ottoman Empire in the 16th century. This source thus allows us to identify the locations with which the imperial center was corresponding at a critical juncture in its history. In this sense, Recogito helped us trace both proxies of war-making and various semantic connotations employed by the center to define its domain.
In line with our objective, Recogito’s user-friendly interface, which did not necessitate specialized knowledge, operationalized the team work in a short period of time. Accordingly, we were able to confirm the usefulness of Recogito, in terms of teaching, learning, and interpreting the history of the Ottoman Empire, a vast geography.
Having completed the annotation process, we reviewed the whole document and checked the accuracy of our annotations. Having detected a high degree of inaccuracy in the richest Ottoman gazetteer that exists in print form, the review process and accuracy control were extremely significant. Identifying the locations of toponymic homonyms (i.e., place names that share the same name but are located in different places) was one of the main problems that we faced during the project. We dealt with this issue by paying attention to the context of each order, as, for example, the clear indications of “to whom” or “for what” the administrative centre addressed the concerned order. During this process, the idea of tagging other spatial entities that are not necessarily toponyms emerged, such as mines, religious foundations, nomadic communities, or rivers. This allowed us to determine the accurate locations of many identical place names, and greatly facilitated the compilation of the gazetteer. Meanwhile, the idea of tagging thematic spatial entities brought a more comprehensive perspective to the project and we expanded the usage of the “Tag” function to the whole document.
The “Tag” function of Recogito provided us with the opportunity to geo-locate these entities, and, in some cases, to relate communities and social attributes to places or regions. Examples of such spatial entities were: bridges, caravanserais; marketplaces; mines; mountains; nomadic communities; pious foundations (vakıfs); prisons; ports; rebellious communities/rebellions; religious schools; shrines; temples; tribes. So far, we have obtained the most profound visual results of tagging by annotating the fortresses and the ports mentioned in the register.
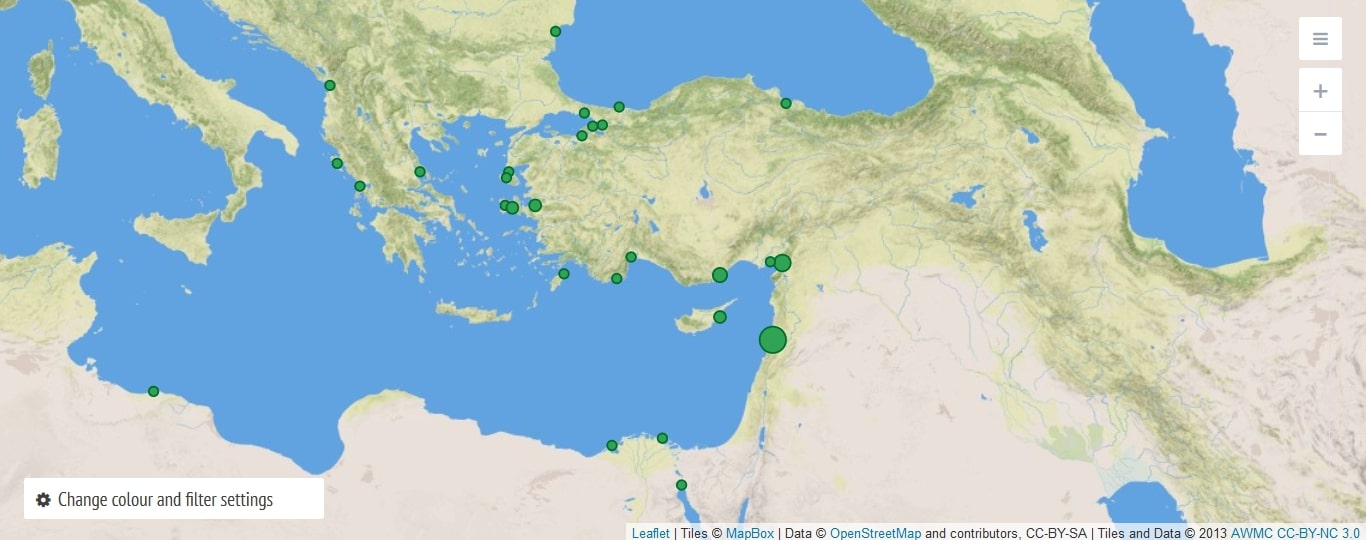
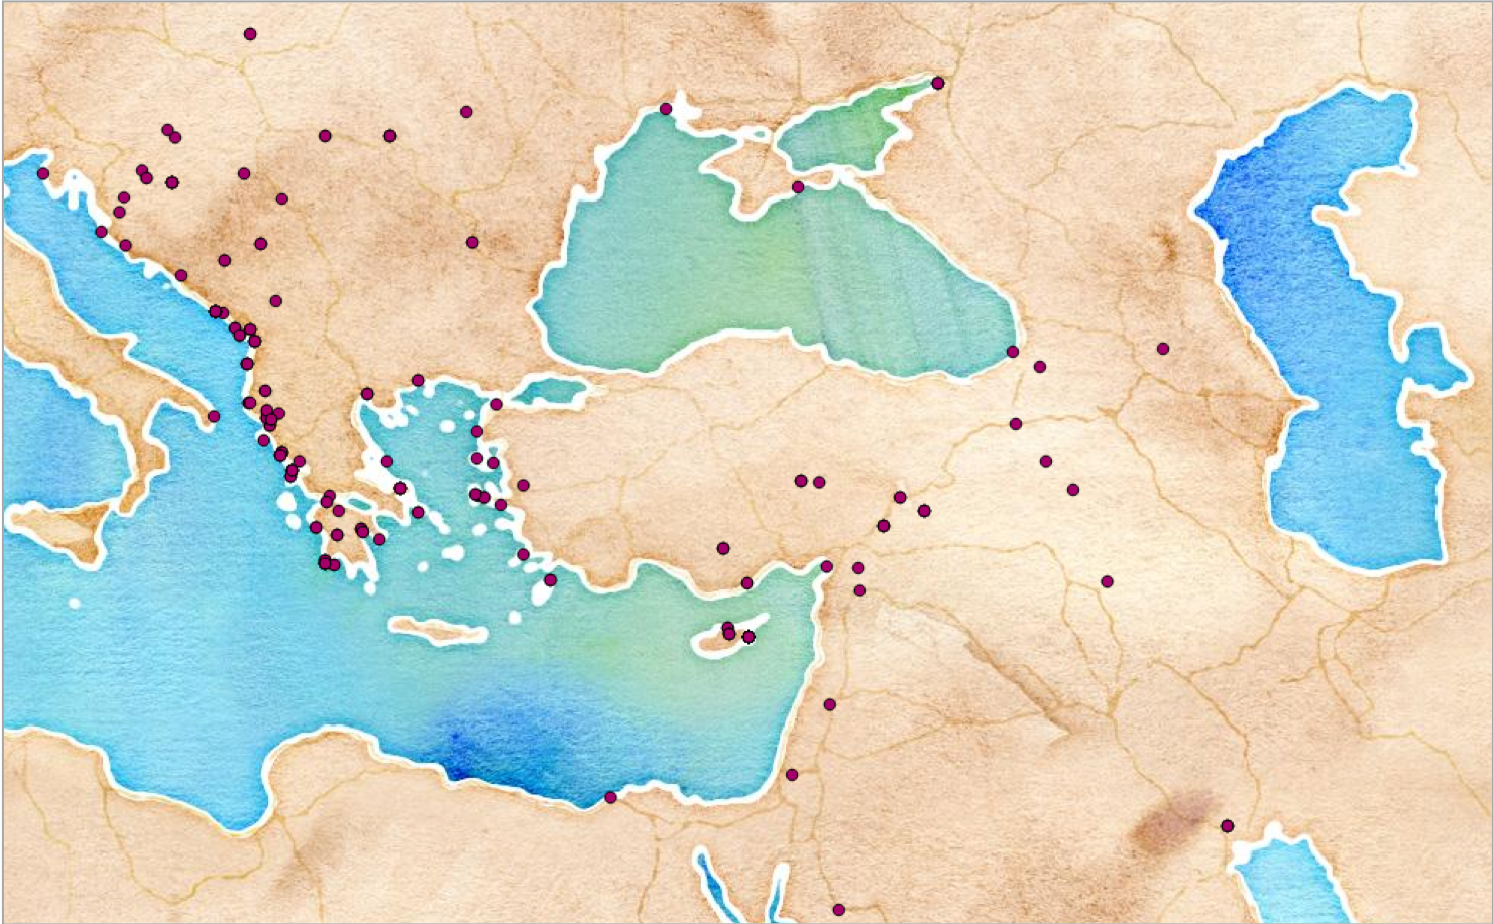
In the Ottoman mühimme register of 1570-1572, we have detected and geo-located 101 fortresses so far (Figure 2). A second map was produced by identifying the places of 29 ports cited in the register (Figure 3). Additionally, we have prepared a database from the pieces of information indicated in the register regarding the physical conditions, usages or managements of the tagged physical entities which has enabled us to come up with a more comprehensive illustrative framework of the 16th-century Ottoman space. These figures are not comprehensive, as tagging was a procedure we initiated at a late stage of double-checking the results, and did not have the time to go back to the beginning before the completion of the project.
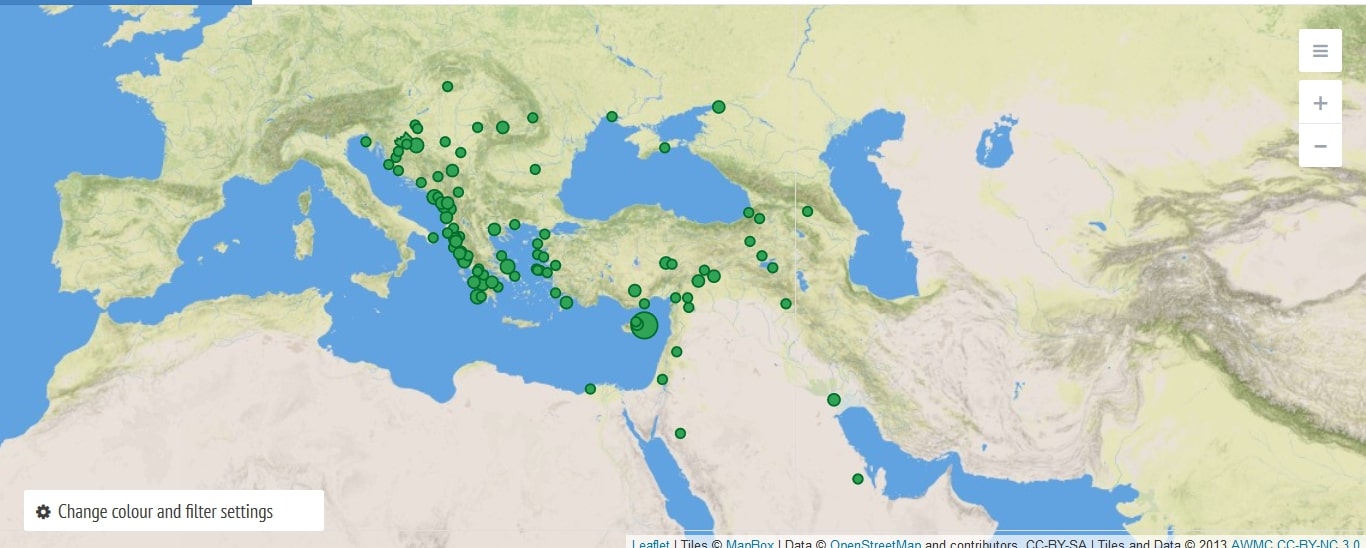
Be that as it may, ports and fortresses correspond to, and should be interpreted in accordance with, the contemporary economic, political, and social contexts of the regions or localities where they are situated. Consequently, both of these entities might be perceived as reciprocally formed by geo-politics and geo-economics. When we look at the maps of frequently mentioned fortresses and ports in the 16th-century register, the first thing that attracts our attention is the peripheral and strategic dispersion of the entities on the maps. While the time when the register was compiled coincides with the Ottoman-Venetian War for Cyprus and the Battle of Lepanto, it reveals “what” and “where” the capital considered as important in military and fiscal terms. Considering that the notion of “border” had a different meaning in the context of early modern empires, these relatively peripheral entities also illustrate the perspective of the center regarding the peripheral limits of the empire. These maps not only show us the strategic edges and bases within the empire, but also the martial and economic contact zones with contiguous political entities such as Venice.
Recogito has allowed us to refine, better organize, collaboratively process, and be more productive in our study of space as a dimension of history, while using mapping as a methodological tool. More importantly, it has contributed to the contextualization of our source in a more comprehensive way where semantic annotations and geo-referencing may enable us to produce new historical inquiries where space and spatiality stand as crucial components of historical research.