This website uses cookies to ensure you get the best experience. By clicking or navigating the site you agree to allow our collection of information through cookies. More info

2 minutes to read Posted on Tuesday August 4, 2020

Updated on Thursday January 25, 2024

portrait of Chiara Zuanni

Chiara Zuanni

Assistant Professor , University of Graz

Mapping museum digital initiatives during COVID-19

During the COVID-19 pandemic, museums continued to build a relationship with their audiences through a range of digital activities. In this post, Chiara Zuanni, assistant professor in digital humanities at the Centre for Information Modelling at the University of Graz, presents a map aiming to collect and visualize the digital initiatives promoted by museums in this period.

A smartphone held up to and capturing a round painting of a castle
Title:
Heritage through a smartphone at Runkelstein Castle
Creator:
Chiara Zuanni
Date:
2018
Country:
Bolzano/Bozen, Italy

Cultural heritage in lockdown

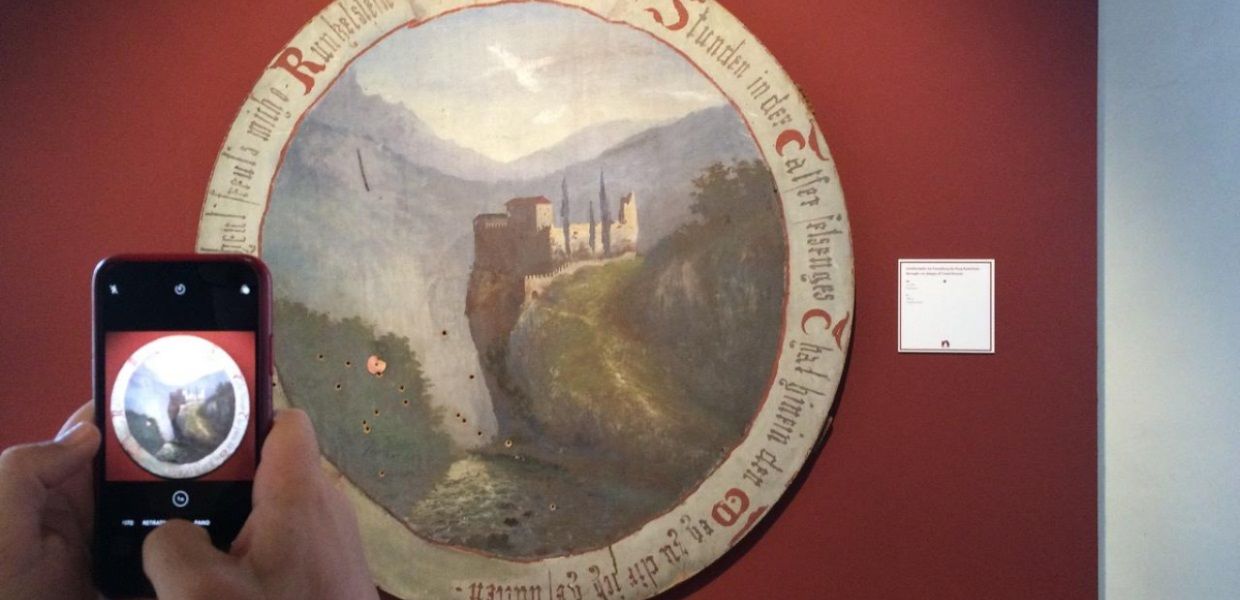
In the first part of 2020, museums were severely affected by the lockdowns enforced by governments around the world due to the COVID-19 pandemic. While closed, museums promoted a broad range of digital projects and activities to continue supporting access to cultural heritage and maintain a relationship with their audiences. Many of these activities have also been highlighted in, and supported by, the media, besides being followed with new curiosity by home-bound audiences. 

Museums have drawn on their existing resources, such as online collection portals and social media accounts. They have also delivered new content, such as virtual exhibitions, curatorial talks and virtual tours of their galleries via streaming platforms, and educational material for children and adults (explore examples of such creative approaches on Europeana Pro). 

On social media, users shared their own re-creation of famous artworks using everyday objects in their houses (using the hashtags #tussenkunstenquarantaine or #gettymuseumchallenge); cultural heritage professionals shared singular objects and stories from their collections using a variety of hashtags (including #MuseumFromHome, #MuseumsUnlocked, #ClosedButOpen, #ClosedButActive, #ArTyouReady); museums joined TikTok (such as the Uffizi, who has been active on this platform since April); and in the new release of the Nintendo franchise Animal Crossing: New Horizons, gamers could add work of arts from institutions including the Getty Museum and the Metropolitan Museum of Art. 

I have been equally fascinated and interested by the innovative ways museums have contributed to the online recreational and informative activities of a broad range of audiences in this period – and in the impact they will have on future digital practices in the sector. For this reason, I have started to document these digital initiatives on a map.
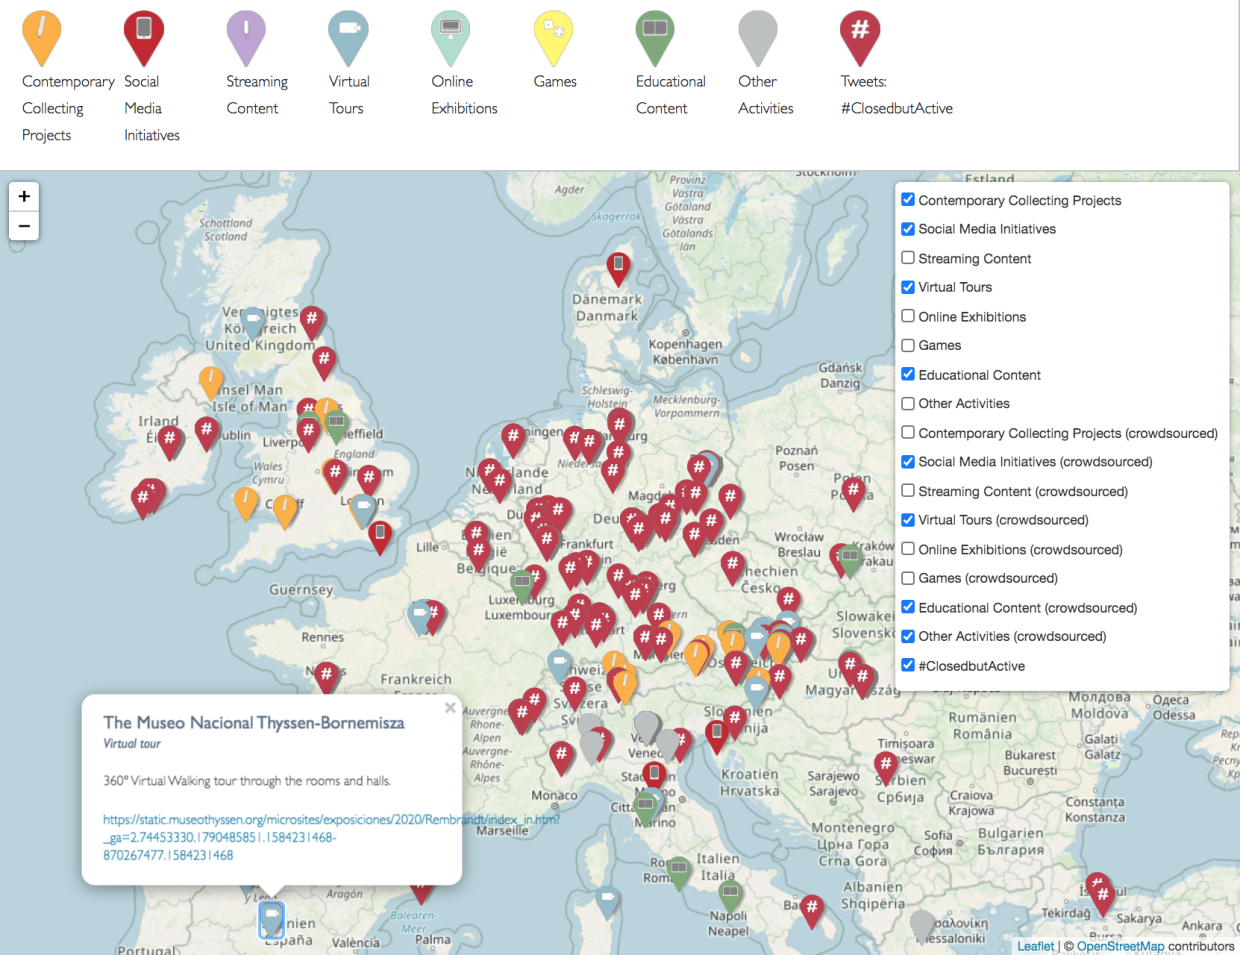
The map

The map, available here, aims to collect and show digital activities developed and promoted by museums during the COVID-19 pandemic. The current dataset is being compiled with the help of Sabrina Melcher, student assistant at the University of Graz, and through crowdsourcing. The categories we chose to sort the various initiatives are: contemporary collecting projects; social media initiatives (i.e. local hashtags and targeted projects); streaming content; virtual tours; online exhibitions; game; educational content; and other types of activities (for initiatives not covered by the previous categories). 

Title:
Map of museums' digital initiatives (screenshot)
Creator:
Chiara Zuanni
Date:
2020

At the moment, these categories are intentionally quite broad and we are aware that the activities within a category could have been deployed using different technologies and methods. In the future, we aim to further develop our categorisation, identifying more subsets in the types of activities. We are also interested in clustering activities around similar uses of technology.

In the case of social media data, although different hashtags have been collected, we chose to show only the #ClosedbutActive Twitter dataset on the map. We chose to show a single Twitter dataset as an example of the reach of this specific hashtag, as due to their volume and size, other social media data would have overwhelmed the presentation and slowed down the website. We aim to showcase the results of the analysis of the other social media data in future visualisations.

We discuss the purpose and rationale behind this map in more detail in an article published in the magazine Cultural Practice.

Contribute to the map and learn more

We are continuously looking for new projects and updating the map in order to build a richer collection of museums’ digital initiatives. We believe in the value of crowdsourcing and want to invite museums and cultural heritage professionals to share their projects. 

This can be done through a short form (it takes less than 10 minutes to complete), which is available in different languages (English, French, German, Greek, Italian, Russian, Spanish). You can submit multiple forms, depending on the number of activities you wish to share on the map. Once a form is completed, we will check and geocode the activity, and a marker will then be added to the map with a description and a link to your digital project. We are looking forward to your help enriching this resource!

top