
Patrick Ehlert
Senior Software Developer , Europeana Foundation
Europeana’s Carbon Footprint
We estimated the carbon footprint of Europeana in three different areas: our online services, our office and foreign travel. Learn how we did it, what our results are and what they could mean for your organisation or business.
.jpg)
In December 2018, as part of a project in the annual Europeana Hack Week, we published a report on Europeana’s carbon footprint While the project aimed to further Europeana’s mission to 'transform the world with culture', it's vitally important that we also be aware of the impacts of our actions, their effects on the world and that we strive to mitigate those. The carbon footprint project was awarded as ‘most impactful idea’ by Europeana Foundation staff and our findings and process are worth sharing.
Results
We focused on calculating the footprint of all our online services, of our offices and of all foreign travel undertaken in 2018. We had to make several assumptions as not all data is available at the ideally detailed level. For example, no electricity consumption figures are available for most of our computer servers so we calculated and used an average electricity consumption for three different types of servers. This does mean that all footprint numbers are approximate, but this is the case for most carbon footprint calculations.
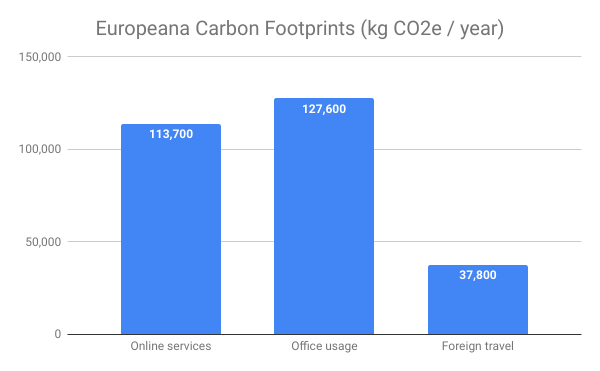
With this in mind, we found that:
- the carbon footprint of all online services is around 113,700 kg of CO2 equivalent (CO2e) per year,
- the footprint of office utility usage (electricity, heating and water) is around 127,600 kg CO2e per year,
- the footprint of all employee foreign travel is around 37,800 kg CO2e in 2018.
In total, we have a footprint of 279,000 kg CO2e which is roughly the same as the footprint of:
- 12.1 average Dutch households (27.6 people); or
- 1.1 million kilometres driven with an average passenger car; or
- 1.2 million large cups of cappuccino
Interestingly, this energy consumption could be sequestered by letting 4,600 new tree seedlings grow for 10 years, every year.
However, to have a more complete carbon footprint picture we would also need to include the daily commutes of Europeana Foundation staff and all travel undertaken by members of the Europeana Network Association. We hope to include these in the future.
What’s next
We hope that our calculations will be the first step towards reducing our carbon footprint. We already know that our online services footprint will reduce in six months when we will decommission all servers used for our recently-replaced, old ingestion system (more on this to come in future articles). We calculated that this could lead to a reduction of up to 42% of the current online services footprint.
Read more
The full carbon footprint report is online as a Google Drive Document. We would love your feedback on it or to hear about the footprint of your organisation. You can make comments directly in the report or send an email to [email protected].