
Annapaula Freire de Oliveira
Former Community Editor , Europeana Foundation
Maps for makers: Globes, spheres, charts and diagrams
This is the last in a blog series dedicated to maps and highlighting Europeana content that can inspire commercial creative reuse by makers.
Throughout the ages, cartographers found many ways of graphically representing spatial data: from maps (including three-dimensional maps) to atlases and globes. In addition to a static and fixed paper format, the advance of technology provided the means for cartographic resources to become dynamic and interactive - helping us to better understand the Earth and beyond. In this last blog, we share our content picks related to different ways of visualizing geographic and celestial data. We hope you will have fun and find inspiration to #MakewithEuropeana.
Diagrams
Diagrams were one of the earliest forms of cartography and data visualization. Based on the positions of stars and other celestial bodies, they helped navigation and exploration. Take a look below at a 16th century horoscope diagram for the day in which the world was created. It includes a world map within an astrological chart and personifications of winds. 12 triangles show symbolic scenes that represent aspects of life associated with the twelve astrological houses.
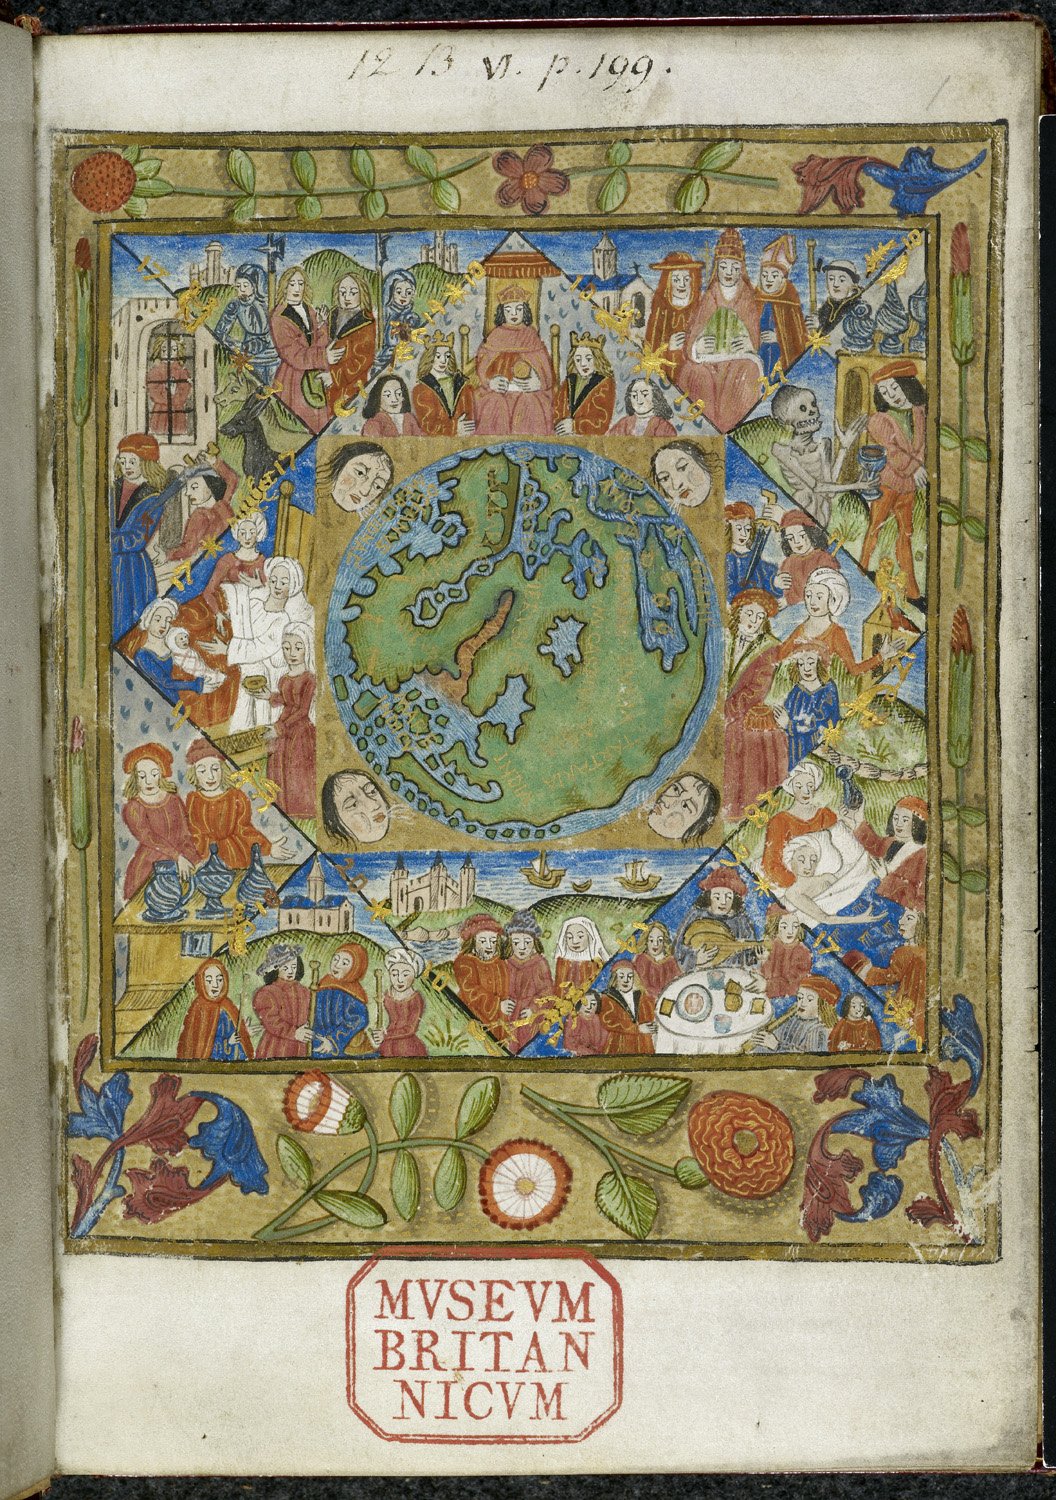
Horoscope diagram from BL Royal 12 B VI, f. 1. 1500 - 1509. William Parron. The British Library. Public Domain Marked.
Portolan charts
Based on compass directions and estimated distances observed by captains at sea, Portolan or portulan charts also used to serve as navigation maps. First made in the 13th century, they were recognized for their accuracy. Check out the example below from the 16th century - it shows the Atlantic Ocean and Northern Europe.
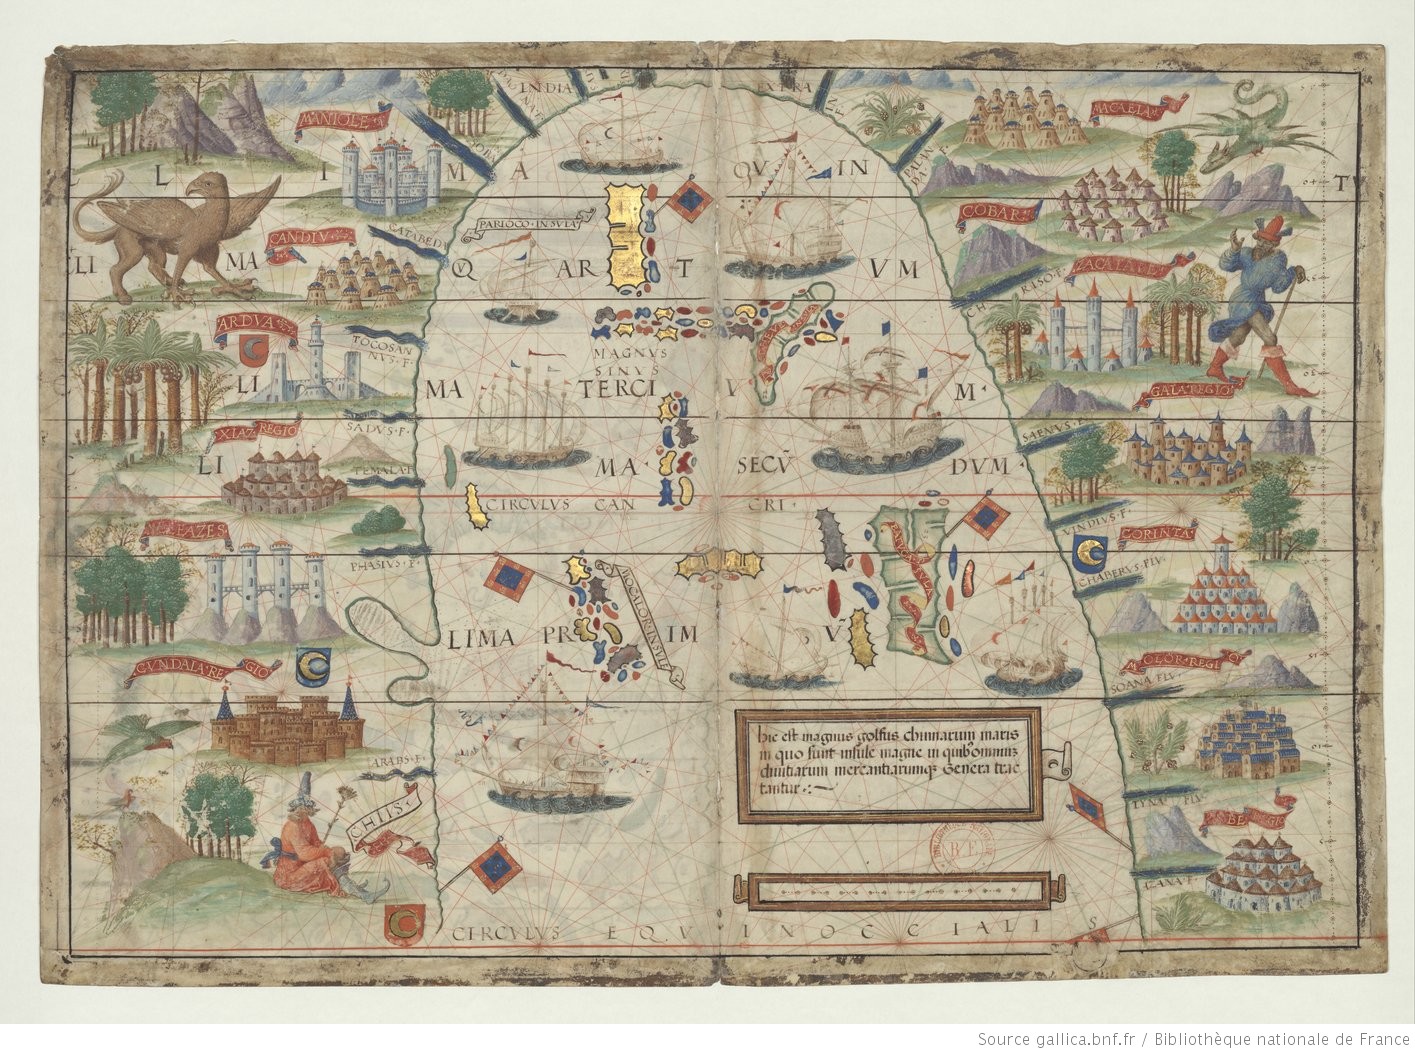
Atlas nautique du Monde, dit atlas Miller. 1519. Homem, Lopo. National Library Of France. Public Domain Marked.
Planispheres
If you like to observe the sky and learn about the movement of stars and of different constellations, a planisphere is the way to go. A hand-held device, planispheres include maps of which stars are visible in the night sky at any particular time. The celestial planisphere below reproduces the curve and the daily movement of the sky above France, divided into geometrical regions.
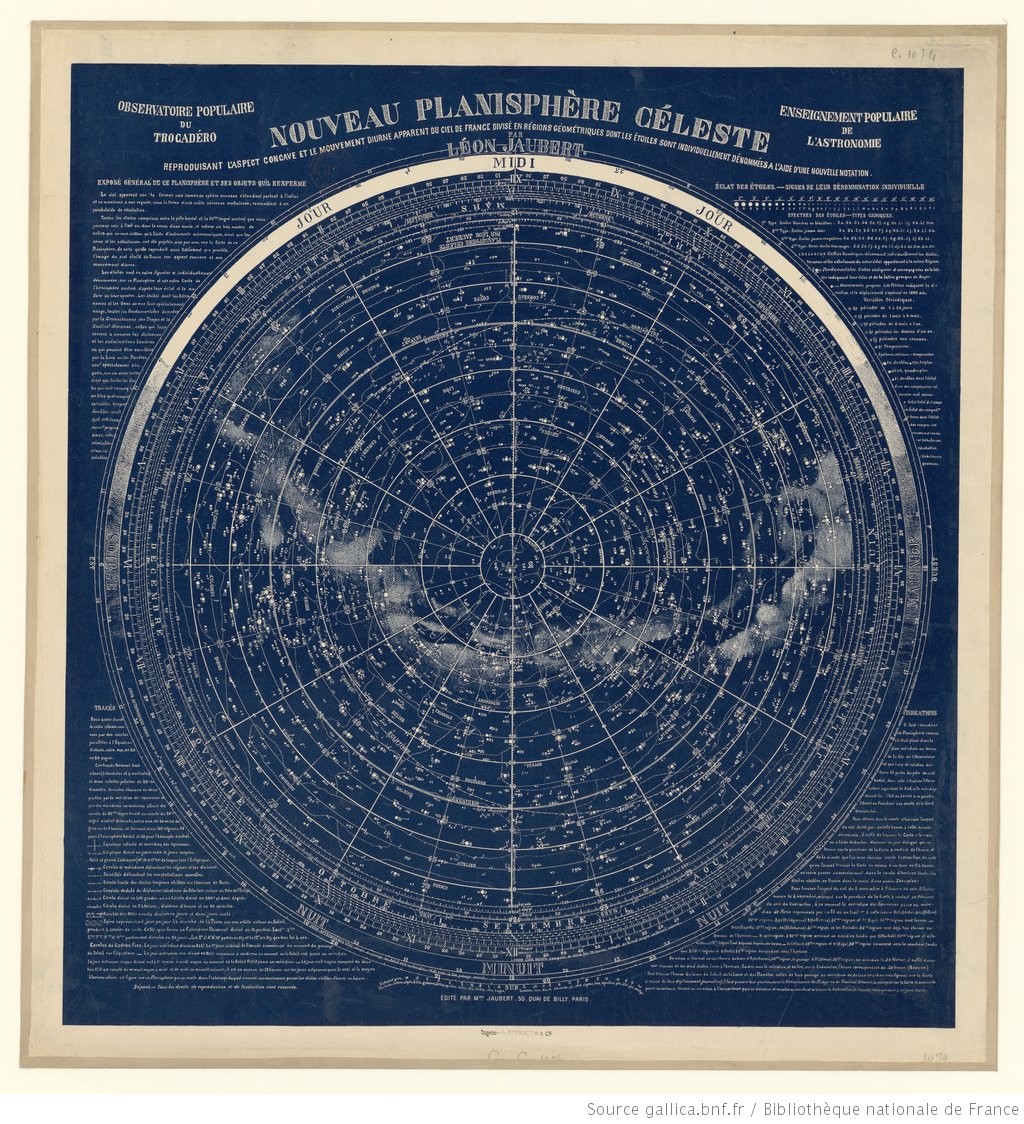
Observatoire populaire du Trocadéro (...) 1889. Jaubert, Léon. National Library Of France. Public Domain Marked.
Globes and spheres
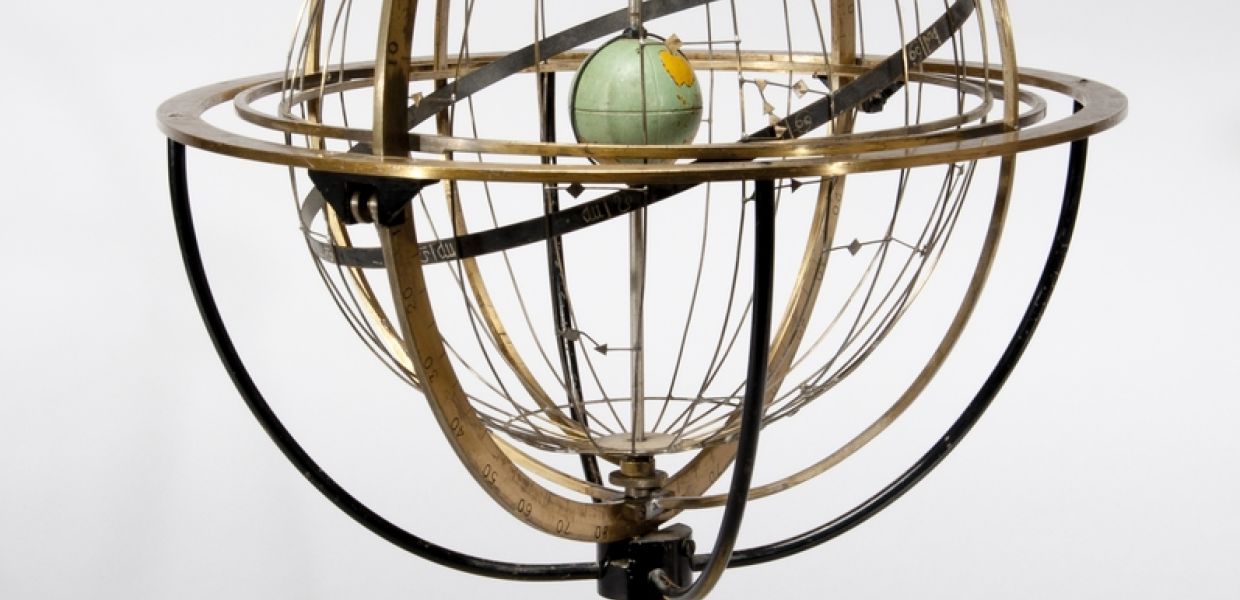
An astronomical instrument made of metal rings with a globe in the center, armillary spheres have been used in the field of astronomy to teach and to determine the positions of the celestial bodies and the path of the sky. Take a look at the example below. The object has a history of technology and science as this was one of the first methods to determine the position of the stars at different times.
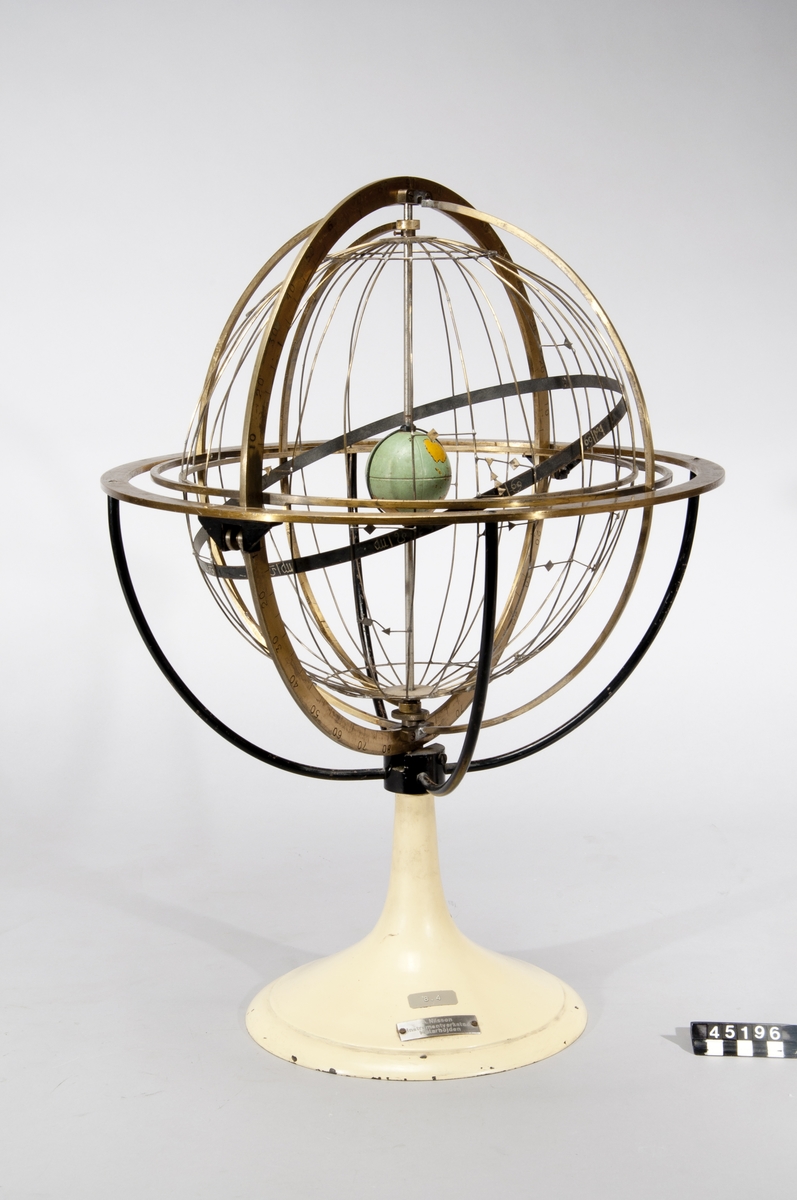
Armillarsfär. A Nilssons instrumentverkstad. Tekniska Museet. CC BY.
Follow us on Europeana Labs and on Twitter for other content picks. And stay tuned: our next makers campaign starts in October!
Do you know anyone who uses maps in their creative practice? Do you #MakewithEuropeana? Get in touch via reuse@europeana.eu!