The Case for logging
Centralized logging and the ELK Stack
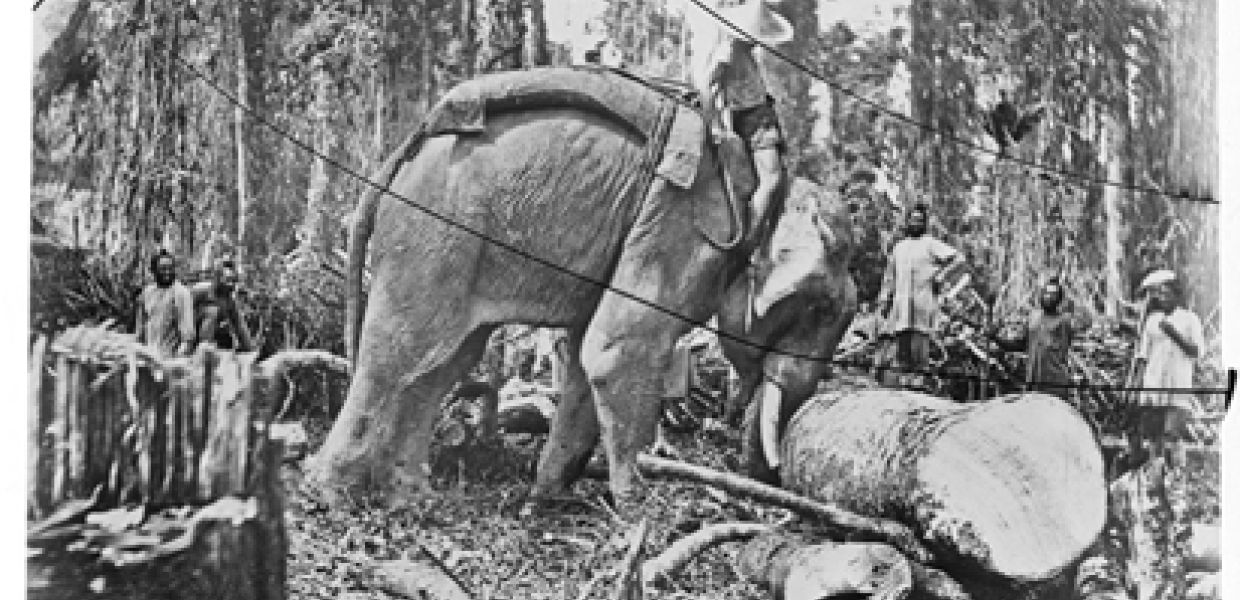
Europeana has a new system of centralized logging. When we say logging we do not mean the process of cutting and loading trees or logs onto trucks, but the process of collecting individual information of a running process.
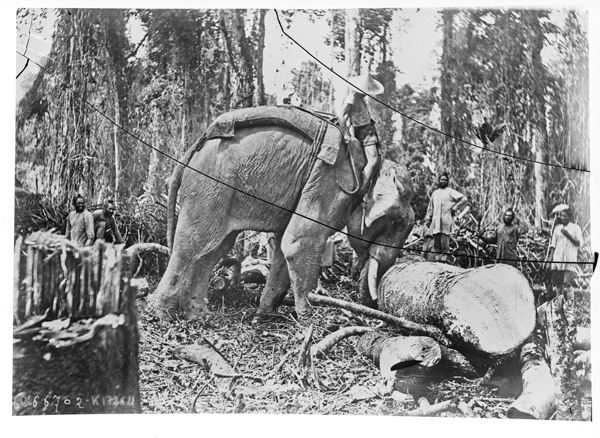
Kobo the elephant pushing a log, National Library of France, 1921, Public Domain
Let’s put logging into simpler words. Logging is about what happened in the past. Imagine your everyday life, most of the things that happened by the end of the day you still remember them. You know that you brushed your teeth after you had breakfast and that you locked the front door of your house before you left. Some things you know in more detail, for example that you had a doctor’s appointment at 13:00 exactly. Many of the things you remember are not particularly important but some are, like a parking spot that is paid the minute - you need to remember when exactly you purchased your ticket and for how long it lasts. This is a natural ‘logging’ in the brain.
In computing, logging is stored in files and these files contain precise time based activities that happened to a particular running software. Each application has it’s own logs. In bigger organisations there are usually a big set of applications that are closely related to each other. Logging in this case can be used to track down failures of a specific part of the application set.
Many of the things that the application will have logged will not be important but when that one failure happens, this log information will be very useful. So logs are there to provide information when something, anywhere, goes wrong. Another use case of logging is to collect and analyze user information, for example recording which country most often accesses your website based on IP address geolocation.
So far so good, everything looks fine, until the application set becomes bigger and bigger and is spread around multiple servers. In such big clusters questions arise like which instance has failed? From which server machine? Which application triggered the failure in the first place? In such systems it becomes very difficult and complicated to track down the series of events between applications, instances and machines.
At this point comes the concept of centralized logging. As the name implies, centralized logging is the concept of consolidating all the logs from multiple places in to one centralized location. So instead of logging in into each of the remote servers to locate a crash problem that one application caused, you have to access only one location, which is faster. What makes it faster is that centralized solutions nowadays provide indexing and filtering of all your logs for searching needs. Centralized logging is also useful because it allows you to identify issues that span multiple servers by correlating their logs during a specific time frame. On top of that, graphical web user interfaces make it much easier for anyone to access.
Europeana has chosen to follow the ELK Stack, Beats and Curator open source solutions. The ELK acronym comes from Elasticsearch, Logstash and Kibana. This approach is free to use, with a big community behind it and all components are developed from the same company named Elastic and are well documented and efficient. A short description of the components:
-
Elasticsearch is a distributed, scalable, highly available database with real-time search and analytics
-
Logstash is a software between the application and Elasticsearch which helps parse the log events into a more meaningful structure for Elasticsearch, with many plugins supported for different needs
-
Beats is a framework used to read the log files from a server and send them to logstash
-
Kibana is the graphical user interface that sits on top of Elasticsearch
-
Curator (as its names implies) curates the elasticsearch database by means of cleaning old indexes and optimizing the new
Following is the original structure model which would handle a very large amount of logs efficiently.
Of course we decided to go step by step and scale as we go and right now we have implemented the 3 layers on the right of this design. We have not included the redis messaging broker and buffer, because so far it was not needed. Currently, then, Europeana has a cluster of 3 elasticsearch nodes on separate dedicated servers with 2TB space each plus 1 logstash instance on another dedicated machine. Kibana, the graphical user interface, is hosted on one of the elasticsearch nodes. On average we currently have 4K documents (log events) served per second and can hold up to 90 days of data with around 40% of the storage used. We host 90 applications transmitting logs into the ELK Stack. So far we haven’t considered scaling more to reach the above design, since everything looks stable at the moment.
Centralized logging is a critical part of any well-maintained IT infrastructure. It is useful for developers and system administrators to monitor all applications at the same time on one screen and having the possibility of searching easily indexed values between them instead of looking for needles in haystacks.
How Kibana’s interface looks on a first glance.
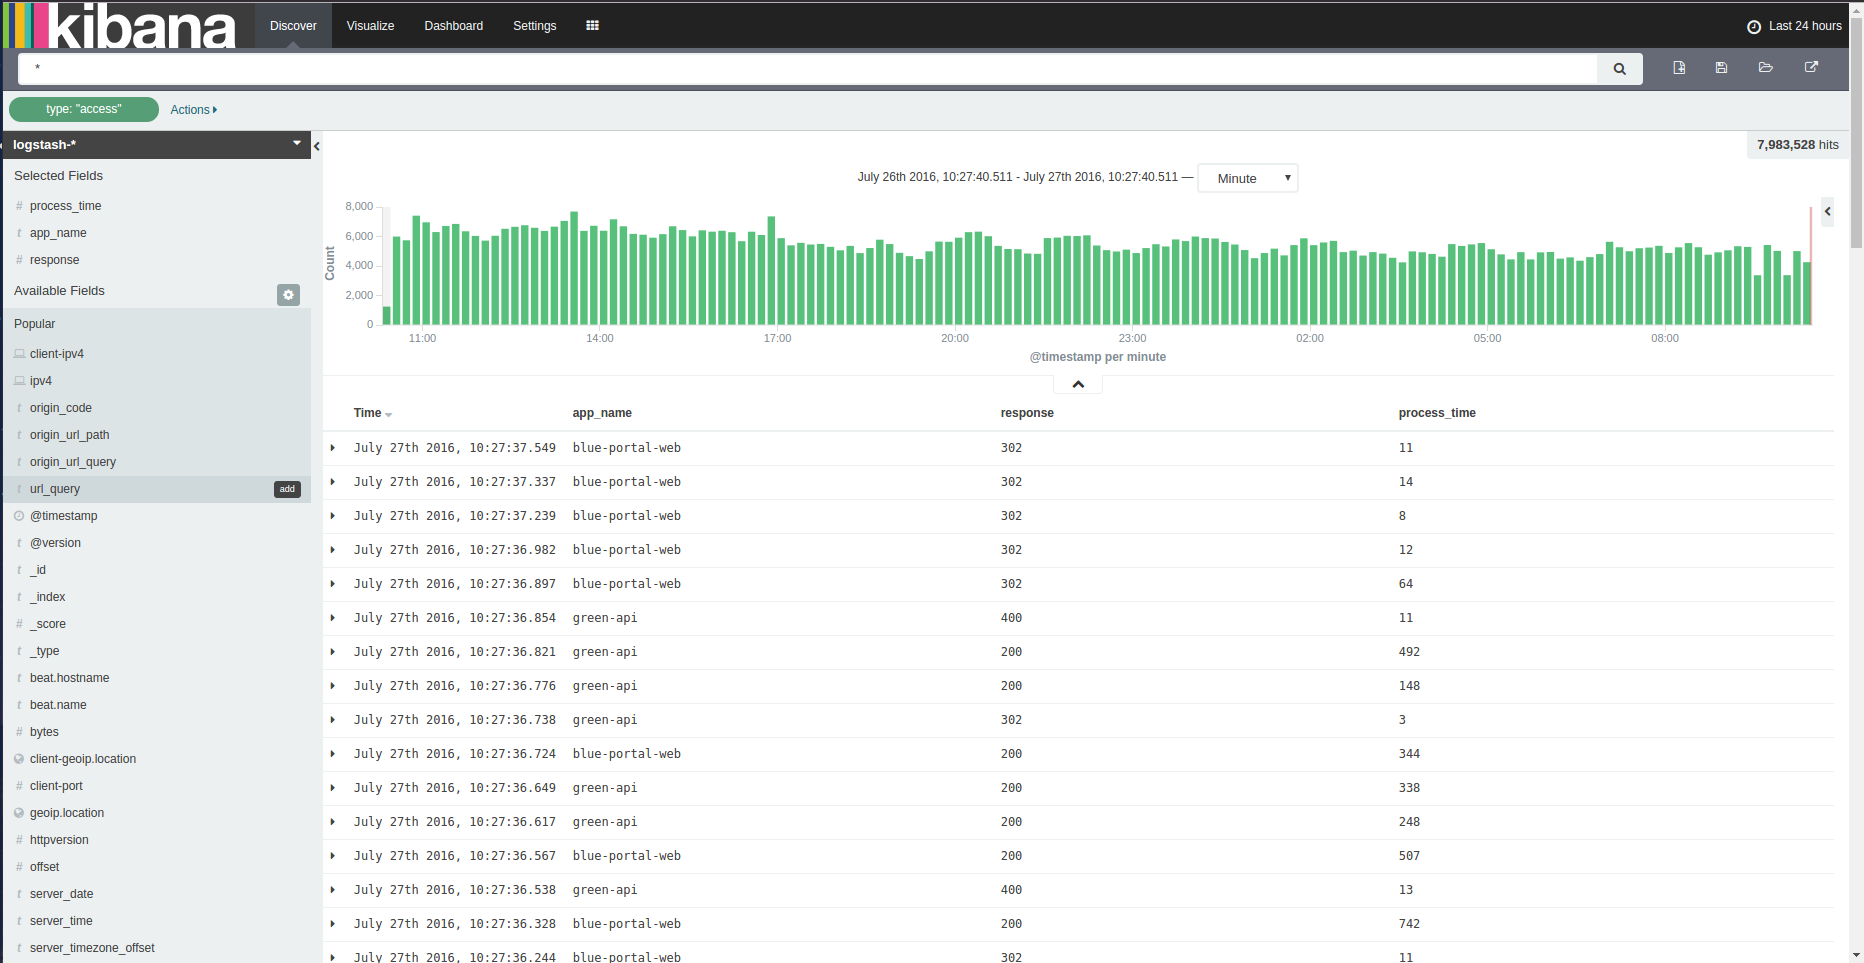
1.Kibana first look
Another use case is that of making visualizations out of your searches to get product information, like all the active unique api keys and how much they are used.

2. API keys visualization
Or even have a visual zoomable map of the IP locations of your clients.
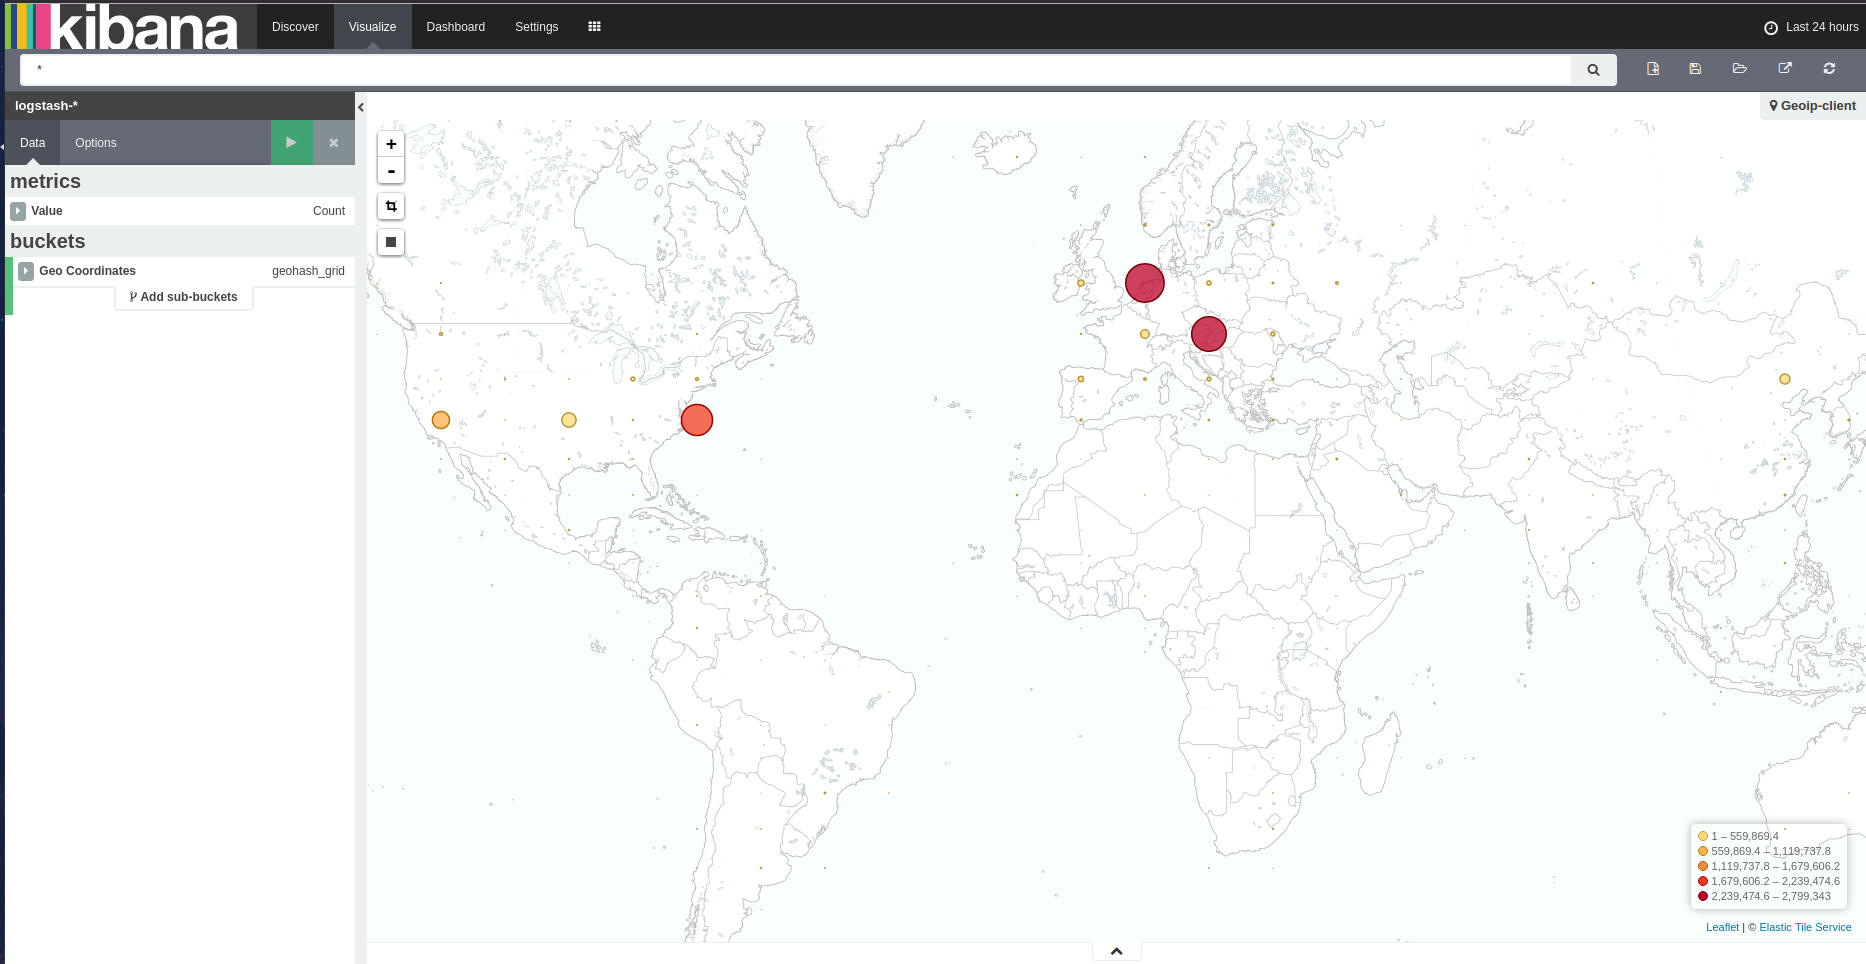
3.API keys visualization
Collecting information on how fast your queries on the database respond is another valuable use case, where you can investigate which queries are slower than normal.
Europeana sees the value of centralized logging as a tool for developers and administrators to investigate and track down problems and failures in our clustering applications, as well as giving us the ability to visualize and collect product information, valuable for reports. This gives us much more insight in what is happening in our fast growing set of applications and services.
Further details on how to structure and install an ELK Stack can be found online and Elastic provides enough documentation and is also easy to follow.