Results of the Europeana User Survey 2014

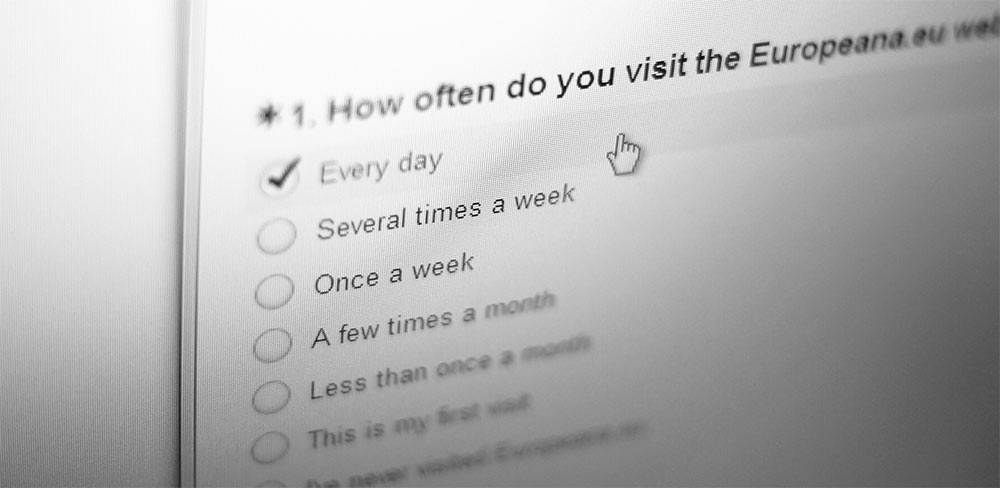
Earlier this year we were all ears with the launch of our biennial user survey, which was answered by over 2,000 users of the Europeana.eu website. Every two years, we conduct such a survey to better understand what our users do when they arrive on Europeana.eu and how they feel about using the website to search, browse and share Europe’s cultural collections.
The feedback that we receive from these user surveys has been integral in the continued development of the Europeana.eu website and related services, it also helps us grasp who our users are, how they generally rate our service and how they think Europeana.eu compares with other services on the web. In the five years that Europeana has existed, we have conducted three user surveys, the previous two being in 2009 and 2011.
Our last user survey, which was launched in Q1 of 2014, was a collaborative effort between a number of teams in Europeana together with User Vision - a UK based usability and accessibility design consultancy. They helped us define the questions we wanted to ask, formulate the survey and then analyse and report on the results. The survey was made available in 6 languages; English, French, German, Spanish, Italian and Polish. All versions of the survey were promoted heavily via the Europeana.eu website and pushed out via Europeana’s extensive social media presence.
Exploration trumps searching
Shortly after closing the survey and starting with the analysis of the results, it quickly became evident that there is a clear trend with the behavior of users on the Europeana.eu website. Based on the results of the survey, the majority of users arrive on Europeana.eu with the aim of browsing within themes and topics rather than searching. For Europeana, this has reinforced the need for prominent and explicit thematic links to support this behaviour. Art, photography and maps were the most popular genres of content for users - this obviously provides a good starting point when it comes to including themeatic entry points on Europeana.eu in the future.
Some other interesting findings include;
The majority of users reported overall experience of the website as 'Good':
The most common reason for the last visit to the Europeana.eu website is 'exploration within a topic':
Users who download digital objects from the Europeana.eu website do so mostly for inspiration and academic research:
To learn more about our findings and conclusions you can read, download and share the Europeana User Survey 2014 Report:
Expand on the report
As always, we are eager for others to expand on our findings. If you are interested in using the raw data from these surveys for further dissemination and research, please use the following links to download the raw data (.ZIP/.CSV); English, French, German, Spanish, Italian and Polish.
If you do make use of the raw data from these surveys in your own research or if you would like access to traffic and usage statistics for Europeana.eu, we would be interested in hearing from you. Please contact Neil Bates (neil.bates@europeana).