Exploring big visual cultural data: an interview with Lev Manovich
On 9-10 July, Europeana Creative's Culture Jam was held at the Austrian National Library. During the two days, Joris Pekel, Community Coordinator for Cultural Heritage, interviewed a number of speakers attending the conference to learn more about their work and their vision for the future of digital cultural heritage.
First in this series is keynote speaker Lev Manovich, author of books on new media theory, Professor at the Graduate Center, CUNY, and Director of the Software Studies Initiative, which works on the analysis and visualization of big visual cultural data. Their projects like Selfiecity, which visualises millions of selfies from all around the world, have gained a lot of attention, not only within the academic field, but within popular culture too.
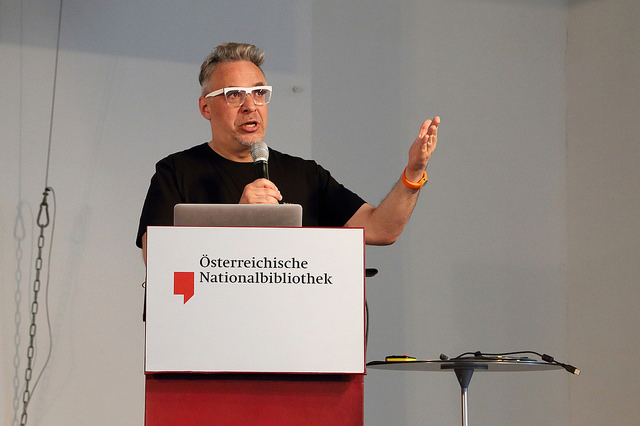
Lev Manovich on stage at #CultJam15. Europeana Creative CC BY-SA
Hi Lev, thanks for taking the time to chat to me. My first question: how are you doing and what is keeping you busy these days?
Hi. At the moment we are using our tools to analyse two different topics. One is the analysis of historical digitised material that largely comes from cultural institutions around the world. The second focus is more on visual culture that you see on social media such as Instagram.
And then there is a third thing actually that combines visual culture and art history. We have been working with a dataset of around one million images of artworks from the largest, or at least it used to be, gallery of user generated art. We got their images from 2001 to 2010. The images are sorted by author and over 2000 different categories were used. We can use this set to look at the evolution over time and ask questions like ‘what is art?’ and analyse what trends in art we can see in the last decade.
We look for example at the type of scene: is it outdoor or indoor? Are there objects displayed? And so on... I am really happy that we are now able to combine our existing visualisation techniques with content analysis to study these large and heterogeneous datasets.
Do you think that these kinds of techniques can be useful for art historians too?
Yes I do. Let me first of all say that I think that art historians or people who study visual culture should not throw away everything they know. All these 20th century techniques and theories remain useful. I do think, however, that these new techniques that are coming from the data visualisation and computer research field should be adopted and people have to get training in this. This is because there are lots of new questions that you can ask using these techniques.
So, for example, you want to find out what people paint today around the world. Not just the 300 famous people in the art world, but everybody else. This means you have to look at thousands or millions of images and you can do that using these techniques. I think these kinds of visualisations can be seen as a new language for the humanities which can supplement the discourses which were created in natural languages.
When I look at your projects such as Selfiecity I see that it is mostly the object which is analysed. How important is metadata for you?
It is possible to explore and study sets of images without metadata. But let me give you the example of the project where we took all of Van Gogh’s paintings and visualised them. Here, we already know that all the objects are from one artist. If we simply want to look at the patterns and colours being used to see what is typical and not typical for his style, then we don’t need other information like time or genre.
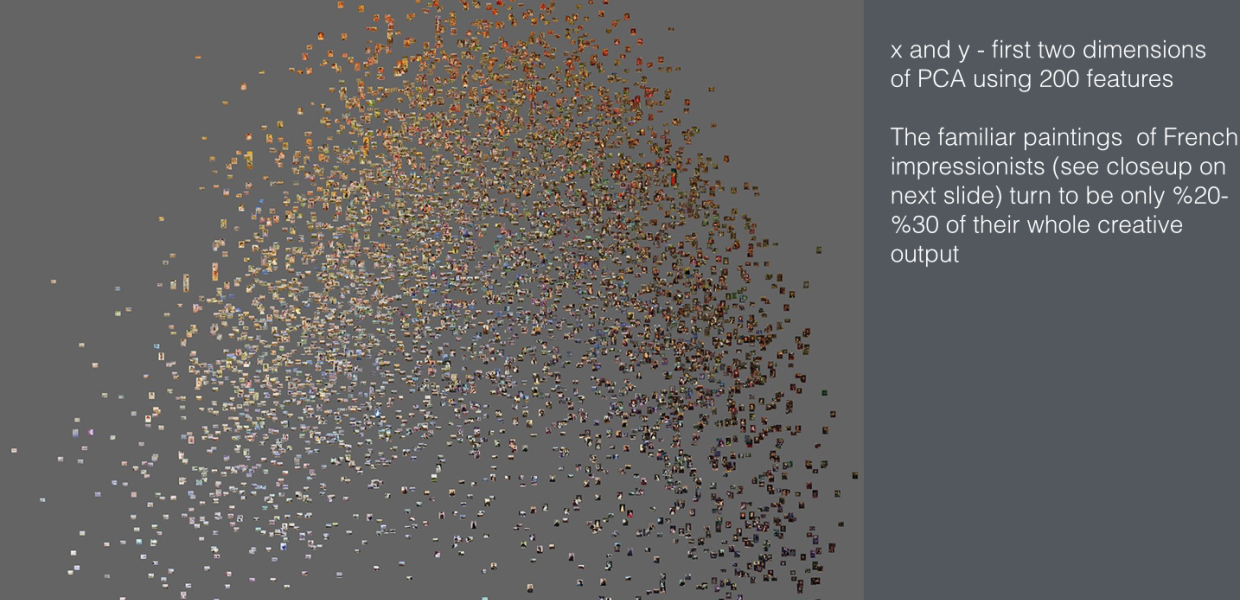
But you see here that if you want to do more, for example a scatterplot over time, then you do need this information. Usually with visualisation you have two, or sometimes three dimensions. Here we can combine metadata, time, geo-location etc, with visual characteristics, colours used, how symmetrical something is etc. You look for example at the evolution of colour or composition over time. So metadata is important, but at the same time it is just one dimension.
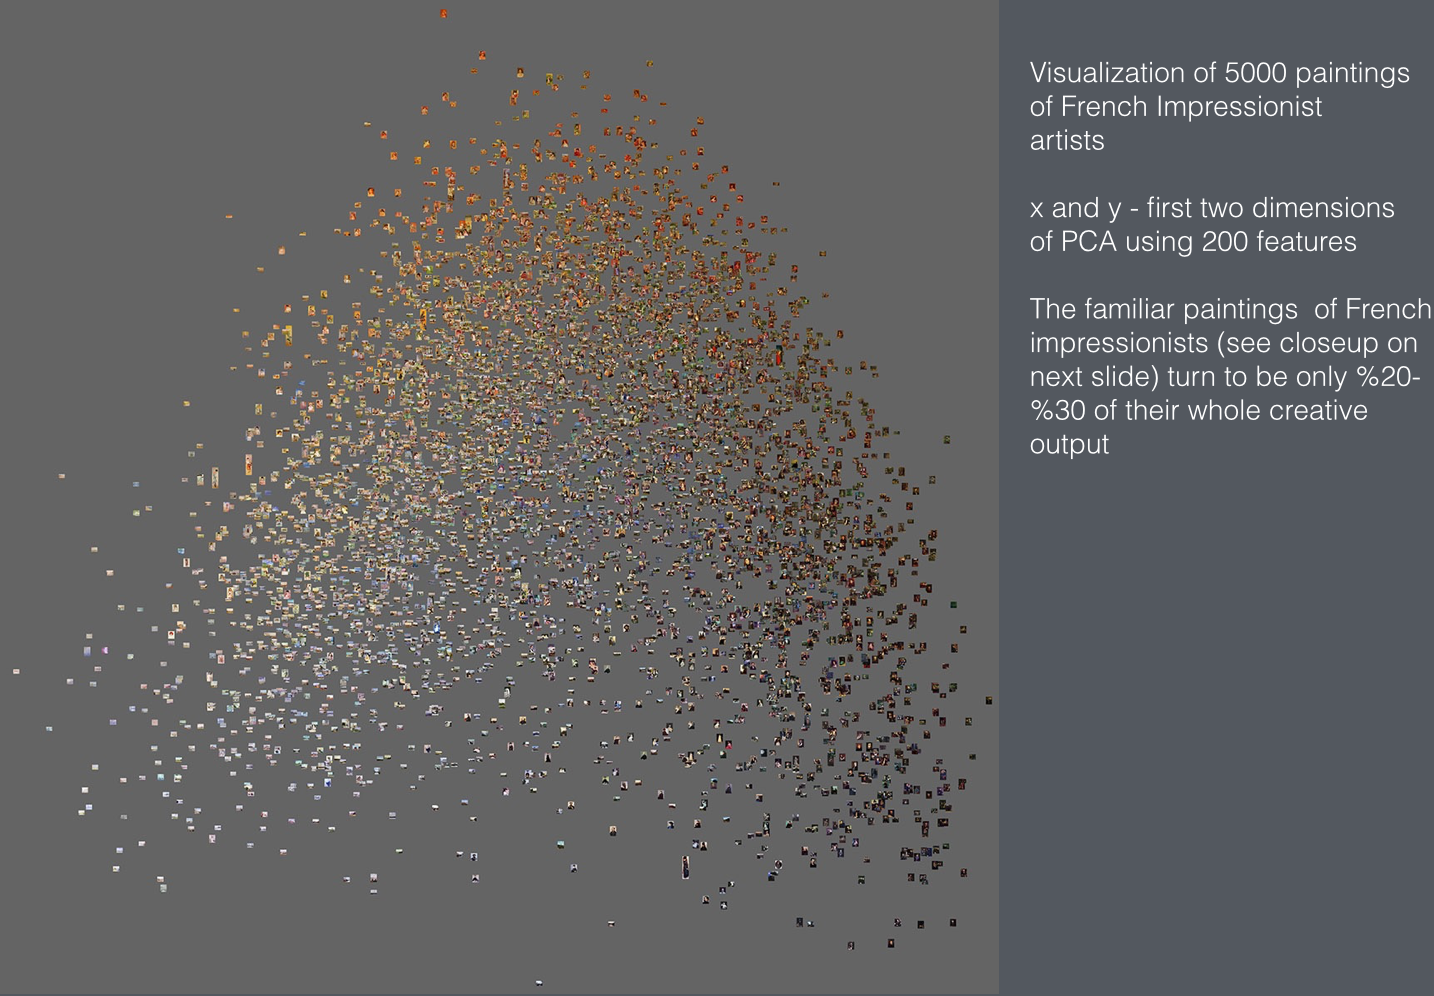
A slide from Lev Manovich's presentation.
Cultural datasets are getting bigger and bigger. How much work does it take you to prepare a dataset? Do you just start, see what comes out of it and improve from there, or do you make sure you have a really comprehensive dataset first?
In every data project whether it is data design or data science it is well known that you spend 70-80% on downloading, analysing and cleaning the data. This is also definitely the case for all the projects we have done. In my experience the only place where you get really clean data is from social media companies as they are commercial companies. When the data comes from a cultural source there is usually a lot of data missing or not consistent, images don’t load etc. So that is one thing. But it of course very much depends on what you want to achieve.
If you take Europeana for example you have 45 million records, and let’s say around a million of the images in your database are of high enough quality. When you are looking for pretty pictures for your application or to put on your t-shirt you don’t need anything coherent as you can just select separate images. However, if you want to understand patterns of historical evolution and look for example at the difference between different cities you actually need to have enough samples.
What would you most like to get from cultural institutions to make your life and research easier?
What I would like to say to cultural institutions is that they not only have to think about publishing their metadata and content, preferably through an API or some other means to make it really easy to download, but they also need to think about how users can get insight into their collection - for example, to see if it covers a certain historical period well enough.
If I want to work with Europeana, for example, I am not going to download all those millions of images. What I want to do is to be able to get all of the metadata as a set of csv files and load them to see characteristics like how many records do we have, records per country, per medium etc. After that I can say ‘ok for my research I want to download all the images from France between 1750 till 1780.’
I think the new generation of digital humanities people could be the big users of a database like Europeana, but to work with collections you not only need to make the metadata accessible, you must also make it easy to figure out what’s inside and how to get it. Give people a flat file saying ‘ok this is what we have’. It can be just a few fields such as artist name, time and country. You basically give people a map how to explore your collection.
Thanks a lot. Looking forward to your future work and publications!
Thanks, it was a pleasure to meet you.