End-User Research: Why We Love Visitors From Social Media
Don’t get me wrong, we love all traffic groups here at Europeana, but we’re especially interested in visitors who come to us from social media. You’ve probably seen us in your feeds Tweeting, updating Facebook, +1ing on Google+, publishing new blogposts and pinning on Pinterest – but what does all this achieve?
Social media is now one of Europeana's fastest-growing traffic groups and in this blogpost I’m going to give you a brief overview of what impact social media has had here at Europeana and what kind of results it’s generating for us in terms of traffic and more importantly engagement.
You might think that behind our social media work, there's a process that looks like this…
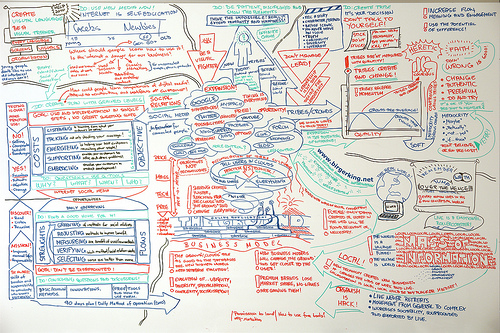
to achieve something as simple as this...

But it's not like that - it's easy and incredibly effective. Social media doesn’t need to be complicated, it's not a new phenonomen, and therefore we can skip the difficult mind-maps and simply focus on the two kids sharing music through a single pair of headphones on a street in Rome. At the end of the day, social media is about the joint use of a resource or space, in our case that would be Europeana.eu and digitised cultural heritage in general. Ultimately we want to distribute digitised cultural heritage and make it easily sharable, and social media as a platform has played an important role in helping us do that.
Quality Over Quantity
For the purpose of this blog entry, the information presented is based on metrics from a rolling year, therefore from October 1 2011 to October 31 2012.
When it comes to traffic from social media, it becomes clear that quality over quantity really matters, social media represents a small minority of our traffic, currently 1.7% to be more precise, however end-users that arrive at Europeana via this source are more engaged and more likely to share when they’re there. Below you'll see that when compared to search engine traffic and the site average, users from social media spend longer on the site, visit more pages and are less likely to bounce on their arrival. What's more is that end-users from social media spend an extra 33 seconds longer on the portal (00:03:03) when compared to the site average (00:02:30). The percentage of new users coming to Europeana from social media is lower when compared with other groups, however this indicates that our end-users from social media are loyal and more likely to return.
| {"dataSourceUrl":"//docs.google.com/spreadsheet/tq?key=0At1Rk6Y4HaPodG9XbWFqRTItNGs1RjNQM1FzUEVEX0E&transpose=0&headers=1&range=A5%3AB8&gid=0&pub=1","options":{"titleTextStyle":{"bold":true,"color":"#000","fontSize":"12"},"animation":{"duration":500},"width":320,"hAxis":{"useFormatFromData":true,"minValue":null,"viewWindowMode":"pretty","logScale":false,"viewWindow":{"min":null,"max":null},"maxValue":null},"vAxes":[{"useFormatFromData":true,"minValue":null,"viewWindowMode":null,"viewWindow":null,"maxValue":null},{"useFormatFromData":true}],"title":"Average Page Depth","booleanRole":"certainty","height":200,"domainAxis":{"direction":1},"legend":"none","focusTarget":"category","tooltip":{},"isStacked":false},"state":{},"view":{},"chartType":"BarChart","chartName":"Chart 1"} | {"dataSourceUrl":"//docs.google.com/spreadsheet/tq?key=0At1Rk6Y4HaPodG9XbWFqRTItNGs1RjNQM1FzUEVEX0E&transpose=0&headers=1&range=C5%3AD8&gid=0&pub=1","options":{"vAxes":[{"useFormatFromData":true,"title":"","minValue":null,"viewWindowMode":"pretty","logScale":false,"viewWindow":{"min":null,"max":null},"maxValue":null},{"useFormatFromData":true,"minValue":null,"viewWindowMode":"pretty","logScale":false,"viewWindow":{"min":null,"max":null},"maxValue":null}],"titleTextStyle":{"bold":true,"color":"#000","fontSize":"12"},"booleanRole":"certainty","title":"Bounce Rate","animation":{"duration":500},"legend":"none","hAxis":{"useFormatFromData":true,"title":"","minValue":null,"viewWindowMode":null,"viewWindow":null,"maxValue":null},"tooltip":{},"isStacked":false,"width":320,"height":200},"state":{},"view":{},"chartType":"ColumnChart","chartName":"Chart 2"} |
| {"dataSourceUrl":"//docs.google.com/spreadsheet/tq?key=0At1Rk6Y4HaPodG9XbWFqRTItNGs1RjNQM1FzUEVEX0E&transpose=0&headers=1&range=E5%3AF8&gid=0&pub=1","options":{"titleTextStyle":{"bold":true,"color":"#000","fontSize":"12"},"vAxes":[{"useFormatFromData":true,"minValue":null,"viewWindowMode":null,"viewWindow":null,"maxValue":null},{"useFormatFromData":true}],"title":"New Visits","booleanRole":"certainty","height":200,"animation":{"duration":500},"legend":"none","width":320,"hAxis":{"useFormatFromData":true,"minValue":null,"viewWindowMode":"pretty","viewWindow":{"min":null,"max":null},"maxValue":null},"isStacked":false,"tooltip":{}},"state":{},"view":{},"chartType":"BarChart","chartName":"Chart 3"} |
Taking things a step further, let’s breakdown some more interesting discoveries related to Europeana and social media:
- Almost half of Europeana’s social media traffic is from Facebook.
- Overall, the United States is Europeana’s sixth most popular country for traffic, however for social media it's the biggest group, followed by Germany and France.
- Almost 3% of visitors from social media were using a mobile device, slightly higher than the site average.
How to Apply What We’ve Learned to Your Project/Organisation
First and foremost, create an advanced segment in Google Analytics for social media - you can learn how to do that here.
After segmenting your social media traffic, rather than measuring just quantity, take a closer look at your qualitative metrics and you’ll be surprised.
Go a step further, breakdown your traffic by each social media source and discover which one is working best for you. Social media is like baking, the more effort you put in, the greater the results.
We’re really interested in hearing your experiences when it comes to all things social media. We understand that it works for some, while for others it doesn’t – but what is important is that we track, measure and share this information within the Europeana Network. I'm currently in the process of setting up Europeana's End-User Research Workgroup, so any information will be used to help expand our knowledge of Europeana end-users and users of digitised cultural heritage in general. I'm also open to hearing any suggestions you might have for collaborations on social media, our channels are open to our partners and we want to work with you in reaching more users outside of the portal. Please contact us by leaving a comment on this blog. Thank you!
Images:
Social Media Sketch - birgerking - CC BY 2.0
Sharing Music Roman Style - Ed Yourdon - CC BY SA